Second Quarter Highlights
- Concerns over the regional banking crisis faded as it failed to morph into a broader calamity, leading financial markets to reverse most of the first quarter’s flight to quality.
- The Federal Reserve (Fed) tightened monetary policy, with just one additional 25 basis point (bp) hike during the second quarter, bringing the policy rate target range to 5.00%-5.25%.
- While the Fed chose not to raise rates at the June Federal Open Market Committee (FOMC) meeting, officials raised their year-end forecast by projecting two additional 25 bp hikes.
- In response to solid economic data and Fed messaging, market pricing is now more in line with FOMC forecasts. Fed fund futures markets are implying a policy rate between 5.25%-5.50% at the end of 2023.
- Headline inflation continues to moderate, while core inflation (excludes food and energy) is proving more difficult to tame.
- U.S. Treasury (UST) yields increased during the quarter, approximating cycle highs. Much of the recent increase has been due to real yields, with Treasury Inflation-protected Securities at the highest yields since the global financial crisis.
- While lower versus the prior quarter, interest rate volatility remains elevated on a historical basis. Meanwhile, equity volatility has reached post-pandemic lows.
- Risk premiums compressed across investment grade and high yield sectors, leading to uniformly positive excess returns across all spread sectors.
Duration Positioning
Near Neutral
Modestly underweight duration by approximately 2% across strategies.
Credit Sector
Overweight
Overweight Financials, Utilities and select Industrial sectors, primarily within Energy-related sub-sectors. Underweight Healthcare, Pharmaceuticals and Non-Corporate Credit.
Structured Products
Overweight
Maintained or increased overweights in Asset-backed Securities (ABS) across most strategies. Remain overweight in Agency Mortgage-backed Securities (MBS) across styles.
Rally caps on!
During the second quarter, fixed income markets largely retraced the first quarter’s flight to quality stemming from the regional banking crisis that began in mid-March. As concerns about broader financial market contagion waned, UST yields moved swiftly higher, while risk premiums narrowed. Investors renewed their focus on the Fed and its perennial struggle to suppress inflation and cool overheated labor markets without inducing the proverbial hard landing. Markets also relented in their fight against the Fed, with fed funds futures pricing now more in line with official projections for the balance of the year.
The Bloomberg Aggregate Index returned -0.84% for the quarter, as rising rates brought the index yield close to 5.00%, just shy of year-to-date highs. Credit spreads rallied, with the investment grade sector producing an excess return of 1.26% (Figure 1). The Financial sub-sector outperformed as spreads compressed 25 bps in the quarter, helping narrow the year-to-date performance gap with Industrials. Structured product risk premiums also compressed, with Agency MBS and ABS generating 76 bps and 58 bps of excess returns, respectively. High yield continued its surprising year-to-date outperformance trend, producing an excess return of 2.79% for the quarter as spreads notched just below 400 bps.
Figure 1. Sector Comparison
Second quarter rally led to positive excess returns across all sectors
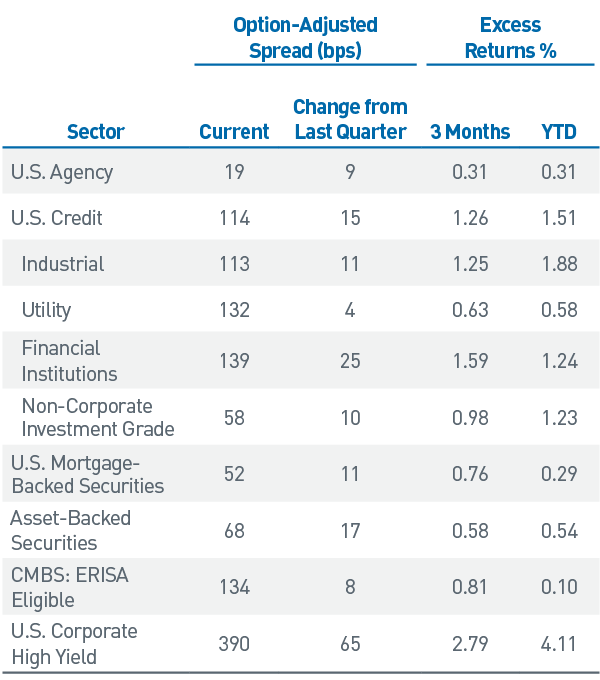
As of 6/30/2023. Source: Bloomberg L.P.
The Fed: And Just Like That…
After raising the fed funds rate at each of the 10 prior FOMC meetings by a cumulative 5%, the Fed left the policy rate unchanged at its June meeting but leaned into a more hawkish outlook. The Fed revised its summary of economic projections to show 50 bps of additional hikes over the balance of 2023, as the Committee’s expectations for growth, inflation and labor market strength increased. Additionally, the Fed subtly revised the wording of its meeting statement in a way that implies further policy firming is wholly expected instead of merely possible. In the weeks following the June meeting, most Fed officials have communicated a similarly hawkish message, largely predicated on progress toward bringing inflation down to the 2% target. Fed futures markets are indicating an additional 25 bps hike in July, and expectations for the fed funds rate to remain over 5% persist well into 2024.
While the June payroll report finally showed signs of cooling, the labor market remains imbalanced. Labor force participation has improved considerably; however, aging workers and below-trend immigration have contributed to more than 1.6 openings for each unemployed worker. Surprisingly, the unemployment rate of 3.6% is unchanged from when the Fed first began hiking rates in March 2022! Wage pressures appear entrenched, as average hourly earnings remain anchored at 4.4%, well above pre-pandemic levels.
The Fed’s steadfast commitment to lowering inflation will require consistent supporting data before ending its tightening regime. Headline inflation has subsided as supply chain bottlenecks ease and energy prices moderate. Core inflation also continues to improve, but the most recent core Consumer Price Index reading of 4.8% remains well above Fed targets (Figures 2 and 3). Additionally, signs of disinflation are welcome but not surprising given the year-over year comparison to last year’s elevated figures. Core goods pricing has shown the most progress, while services inflation is proving more persistent. Given diminished banking industry concerns, we believe the Fed now has the ability to focus its attention on tackling inflation as opposed to ensuring stability in the financial system.
Headline inflation has retreated significantly, but progress on core inflation remains more modest.
Figure 2. CPI, year-over-year (YoY) change, %
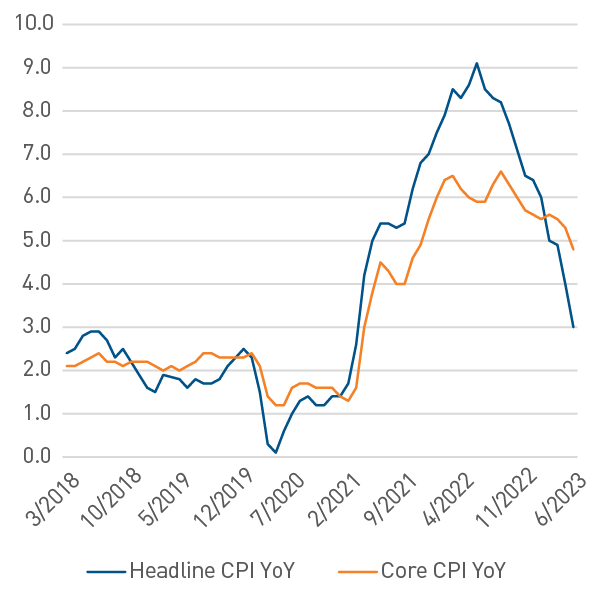
Figure 3. CPI, month-over-month (MoM) change, %
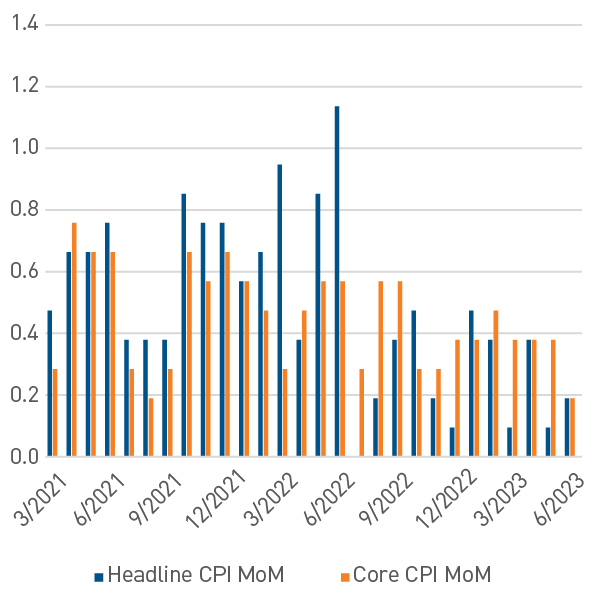
As of 7/12/2023. Source: Bloomberg L.P.
Markets have been remarkably sanguine as implied fed funds rate cuts have been pushed out until the second quarter of 2024. Risk assets — both spread sectors and equities — have largely shrugged off recent yield increases after spending much of 2022 fixated on the direction of USTs. Muted reactions may be due to budding optimism for the possibility of a soft landing, despite the most aggressive tightening campaign in four decades. While economic resilience has been remarkable to date, it is worth noting that forecasts from FOMC staff economists anticipate a mild recession to begin later this year.
Not to be overlooked are various market liquidity dynamics as the Fed reduces its $8.3 trillion balance sheet. Emergency funding programs related to recent banking stress are winding down, and with FDIC portfolio liquidations largely complete, the Fed is able to refocus on quantitative tightening. In addition, the recent deal to raise the debt ceiling has allowed the U.S. Treasury to significantly ramp up Treasury bill (T-bill) issuance. Liquidity investors, particularly money market funds, have easily absorbed this supply, helping bring the Fed’s Reverse Repurchase Program (RRP) balance back below $1.8 trillion (Figure 4).
Figure 4. Fed Balance Sheet vs. RRP Balance, $ billions
Liquidity investors absorbing T-bill issuance amid continued Fed balance sheet reduction
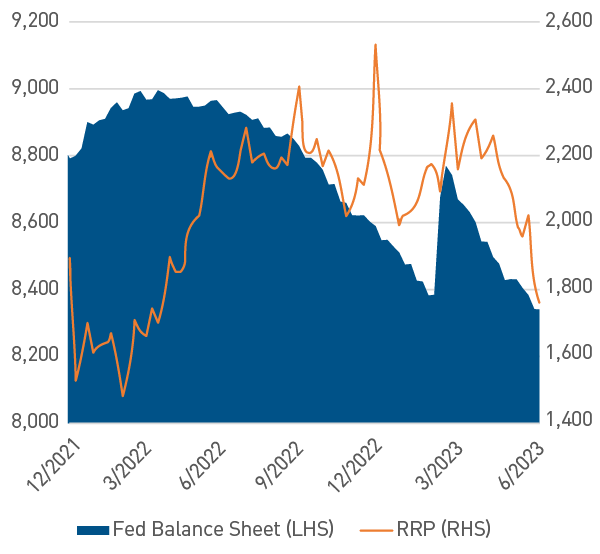
As of 6/30/2023. Source: Bloomberg L.P.
Structured Product Tilt Across the “BS” Sectors
Similar to recent quarters, our portfolio positioning continues to be largely tactical given the fluid market backdrop. We believe current macroeconomic pressures on interest rate volatility and risk premiums warrant a defensive, yet opportunistic, approach.
Corporate new issue markets were subdued in March and April given concerns surrounding the banking system. But as worst-case fears diminished, issuers quickly returned. Much of that issuance came from higher quality Industrial companies, providing us attractive opportunities to increase exposures at favorable pricing given elevated new issue concessions.
Dislocations in market liquidity presented similar opportunities in secondary trading, where additions in high-quality banks proved beneficial. The Financial sub-sector outperformed in the second quarter, partially due to a snapback from first quarter’s significant underperformance. Smaller, less diversified regional banks continue to trade at stressed levels, but the larger financial institutions we emphasize have seen their risk premiums stabilize. We believe this trend should continue as deposit flight has subsided and fundamentals remain relatively healthy. Financial sector valuations generally remain attractive relative to Industrials, providing opportunities to maintain modest portfolio overweights.
We maintain a favorable view of securitized markets, as Agency-backed mortgage valuations remain attractive on a historical basis. The overhang on valuations from FDIC liquidations of MBS tied to the recent bank failures has largely dissipated. Additionally, slow and stable prepayments along with light new origination and moderating volatility have boosted fundamentals. The Fed continues to shrink its balance sheet, albeit at a slow pace as MBS holdings still top $2.5 trillion. We have maintained overweights in both aggregate and non-aggregate styles as we see the potential for further spread compression.
It is a similar story in ABS markets, as credit trends remain solid in the prime categories where we focus. In subprime, however, there has been a notable deterioration in asset quality performance. A strong labor market with healthy wage gains should continue to support the consumer, although the resumption of student loan payments in the fall presents a headwind. Nonetheless, we continue to believe the sector is a favorable AAA-rated alternative to corporate credit that provides opportunities for incremental yield and strong risk-adjusted returns.
Sunny Disposition Masks Cautious Demeanor
As credit spreads compressed toward the end of the quarter, valuations once again began looking stretched, similar to the period just before the Silicon Valley Bank collapse. Given the sudden, episodic shifts in volatility over the past 18 months, reducing credit risk exposure is top of mind for us. We would not be surprised if the lagged effect of monetary policy tightening and headwinds from waning fiscal support result in additional challenges in the coming months. Inflation remains a problem for developed market central banks, while tightening financial conditions have withdrawn liquidity from the global system. We believe this is likely to result in higher policy terminal rates for an extended period, conditions that are ripe for more episodic volatility.
An additional concern is the faltering recovery in China and its implication for global growth. Disinflationary forces in China are noteworthy, as the most recent year-over-year CPI figure slowed to 0.0%. Coupled with ongoing concerns about unsustainable debt levels in the country’s property sector, additional weakness could spill over into the broader global economy. Potential stimulus measures could ameliorate concerns, but the situation warrants attention, particularly against the backdrop of continued geopolitical tensions between the United States and China.
The odds of a soft landing have improved substantially from the first quarter, when a recession felt unavoidable, but a healthy degree of caution is still warranted. Given how monetary and fiscal tightening transpired in such short order, we believe it is prudent to maintain a defensive posture in order to maintain flexibility amid potential volatility. While valuations on risk assets have rallied significantly, the sector we favor for its more defensive risk-adjusted returns — Structured Products — still offers compelling relative value. A more tactical and nimble approach has proven successful since late 2021, and we suspect conditions over the balance of the year may yield similar opportunities.
Important Disclosures
Indices
The Bloomberg US Aggregate Bond Index is a broad-based benchmark that measures the investment grade, U.S. dollar-denominated, fixed-rate taxable bond market. The index includes Treasuries, government-related and corporate securities, MBS (agency fixed-rate and hybrid ARM pass-throughs), ABS and CMBS (agency and nonagency).
The Bloomberg US Aggregate Corporate Index represents the total return measure of the corporates portion of the Barclays U.S. Aggregate Index.
The Bloomberg US Credit Index measures the investment grade, US dollar-denominated, fixed-rate, taxable corporate and government related bond markets. It is composed of the US Corporate Index and a non-corporate component that includes foreign agencies, sovereigns, supranationals and local authorities.
The Bloomberg U.S. Corporate High Yield Index measures the performance of USD-denominated, non-investment grade, fixed rate, taxable corporate bonds, including corporate bonds, fixed-rate bullet, putable, and callable bonds, SEC Rule 144A securities, Original issue zeroes, Pay-in-kind (PIK) bonds, Fixed-rate and fixed to-floating capital securities.
The Consumer Price Index (CPI) is a measure of the average change over time in the prices paid by urban consumers for a market basket of consumer goods and services.
BLOOMBERG® and the Bloomberg indices are service marks of Bloomberg Finance L.P. and its affiliates, including Bloomberg Index Services Limited (“BISL”), the administrator of the index (collectively, “Bloomberg”) and have been licensed for use for certain purposes by PNC Capital Advisors LLC. (PCA). Bloomberg is not affiliated with PCA, and Bloomberg does not approve, endorse, review, or recommend this material. Bloomberg does not guarantee the timeliness, accurateness, or completeness of any data or information relating to the information herein.
This publication is for informational purposes only. Information contained herein is believed to be accurate, but has not been verified and cannot be guaranteed. Opinions represented are not intended as an offer or solicitation with respect to the purchase or sale of any security and are subject to change without notice. Statements in this material should not be considered investment advice or a forecast or guarantee of future results. To the extent specific securities are referenced herein, they have been selected on an objective basis to illustrate the views expressed in the commentary. Such references do not include all material information about such securities, including risks, and are not intended to be recommendations to take any action with respect to such securities. The securities identified do not represent all of the securities purchased, sold or recommended and it should not be assumed that any listed securities were or will prove to be profitable. Past performance is no guarantee of future results.
PNC Capital Advisors, LLC claims compliance with the Global Investment Performance Standards (GIPS®). A list of composite descriptions for PNC Capital Advisors, LLC and/or a presentation that complies with the GIPS® standards are available upon request.
PNC Capital Advisors, LLC is a wholly-owned subsidiary of PNC Bank N.A. and an indirect subsidiary of The PNC Financial Services Group, Inc. serving institutional clients. PNC Capital Advisors’ strategies and the investment risks and advisory fees associated with each strategy can be found within Part 2A of the firm’s Form ADV, which is available at https://pnccapitaladvisors.com.
©2023 The PNC Financial Services Group, Inc. All rights reserved.
FOR INSTITUTIONAL USE ONLY
INVESTMENTS: NOT FDIC INSURED-NO BANK GUARANTEE – MAY LOSE VALUE