Markets are increasingly ebullient on the reported efficacy of several vaccines and the potential for the COVID pandemic to be brought under control in 2021. Despite on-going histrionics, investor appetites were whetted as markets look past the contentious election to a more hopeful outlook supported by continued monetary policy support and the potential for additional fiscal stimulus. While Americans gathered for a non-traditional Thanksgiving feast, market participants gorged on risk assets over the course of November. The Bloomberg Barclays U.S. Credit Index produced over 200bps of excess return during the month with the index Option-Adjusted Spread (OAS) tightening by 19bps to 100bps. Lower quality outperformed, with BBBs besting higher quality investment grade sectors by over 100bps; high yield excess returns approached 400bps.
We share the markets’ growing optimism for a normalization of economic conditions next year. However, we have near-term concerns not just with current developments in the course of the pandemic but, more importantly, the continued evolution of risk characteristics in the corporate credit market that heightens risk/return asymmetry. With more scarce sources of alpha, we believe investors will be rewarded by considering more defensive portfolio risk allocations given current market dynamics. While widely covered in the press generally, we feel it is prudent to highlight three notable developments in the corporate market.
Yield to Worst
Global yields have been pulled lower over the course of 2020 due to slowing economic growth and extraordinary central bank support; the Bloomberg Barclays Global Aggregate Negative Yielding Debt Index is at a record high and approaching $18 trillion in market value. While the Bloomberg Barclays Aggregate Bond Index yield to worst has risen modestly off all-time lows, the move in credit spreads over the course of November has pushed U.S. credit yields to all-time lows (Chart 1).
Quality
With an increasing concentration of BBB-issuance, trends in benchmark credit quality composition have been deteriorating since the Great Financial Crisis. Disruptions to commercial paper markets with the initial outbreak of the pandemic – combined with enticing overall yields on new issues – boosted higher quality issuance in 2020 as overall gross supply reached a record $1.5 trillion (Chart 2).
Duration
Asymmetry is particularly pronounced when considering the duration of the Bloomberg Barclays U.S. Credit Index, which has risen by a remarkable 1.5 years since the end of 2018 (over 20%). Dislocations in short-duration credit, combined with the enticing yield dynamics of longer-term issuance, have incentivized corporations to extend liability maturities. Duration profiles increased due to lower coupons from declining yields and tighter spreads. With a current index OAS in the mid-90s, the break-even spread-widening event that would overwhelm annual carry barely exceeds 10bps (Chart 3).
Conclusion
As we pivot to the turn of the year and eagerly put 2020 behind us, we continue to focus on managing the risk profiles of our client portfolios. This has served us well over the last several years and enabled us to deliver a consistent excess return profile through a variety of market cycles. Broadly, we believe market risk sectors are expensive and expect subsector and issuer selection decisions will present opportunities for incremental alpha in 2021. We appreciate our clients’ on-going commitments to our strategies and wish everyone a healthy and happy holiday season.
Chart 1
Bloomberg Barclays U.S. Credit Index - Yield to Worst
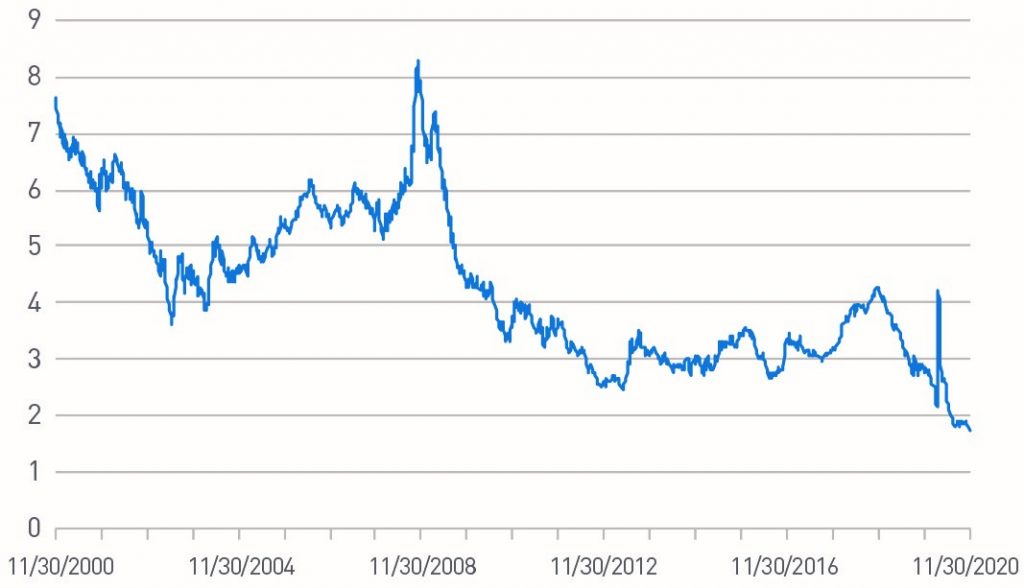
Data from 11/30/2000 to 11/30/2020. Source: Bloomberg L.P., PNC Capital Advisors
Chart 2
Quality Analysis of Bloomberg Barclays U.S. Credit Index
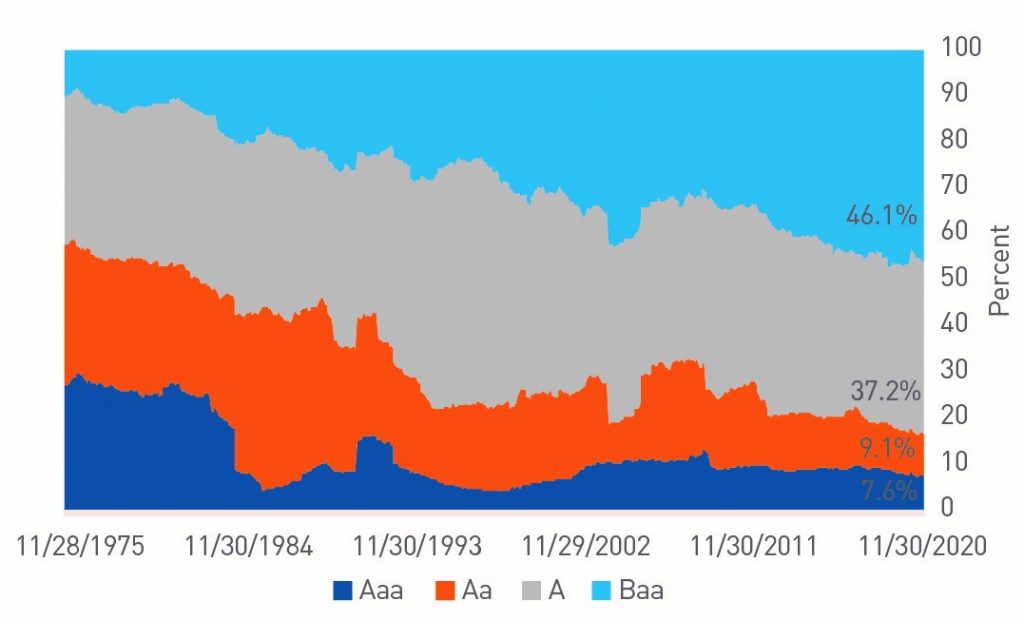
Data from 11/28/1975 to 11/30/2020. Source: Bloomberg L.P., PNC Capital Advisors
Chart 3
Bloomberg Barclays U.S. Credit Index – Modified Adjusted Duration
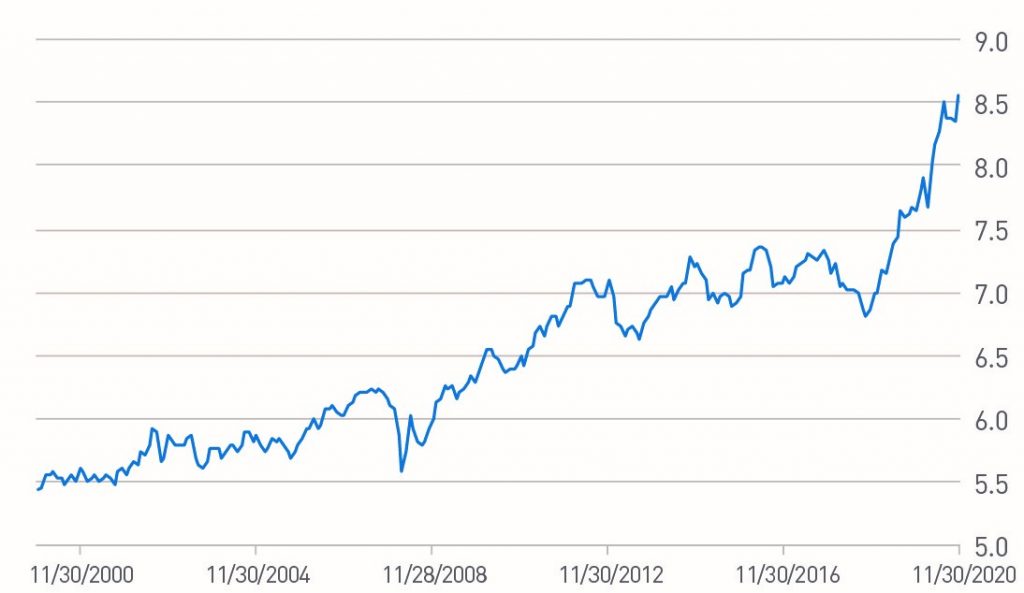
Data from 11/30/2000 to 11/30/2020. Source: Bloomberg L.P., PNC Capital Advisors
Indices
The Bloomberg Barclays U.S. Credit Index measures the investment grade, U.S. dollar-denominated, fixed-rate, taxable corporate and government related bond markets. It is composed of the U.S. Corporate Index and a non-corporate component that includes foreign agencies, sovereigns, supranationals and local authorities.
The Bloomberg Barclays U.S. Aggregate Bond Index is an unmanaged index composed of securities from the Bloomberg Barclays Government/Corporate Bond Index, Mortgage-Backed Securities Index and the Asset-Backed Securities Index and represent the investment grade, U.S. dollar-denominated, fixed-rate taxable bond market.
The Bloomberg Barclays Global Aggregate Negative Yielding Debt Index represents the negative yielding segment of the global investment grade debt from twenty-four local currency markets. This multi-currency benchmark includes treasury, government-related, corporate and securitized fixed-rate bonds from both developed and emerging markets issuers.
Important Disclosures
BLOOMBERG® is a trademark and service mark of Bloomberg Finance L.P. and its affiliates (collectively “Bloomberg”). BARCLAYS® is a trademark and service mark of Barclays Bank Plc (collectively with its affiliates, “Barclays”), used under license. Bloomberg or Bloomberg’s licensors, including Barclays, own all proprietary rights in the Bloomberg Barclays Indices. Neither Bloomberg nor Barclays approves or endorses this material, or guarantees the accuracy or completeness of any information herein, or makes any warranty, express or implied, as to the results to be obtained therefrom and, to the maximum extent allowed by law, neither shall have any liability or responsibility for injury or damages arising in connection there with.
This publication is for informational purposes only. Information contained herein is believed to be accurate, but has not been verified and cannot be guaranteed. Opinions represented are not intended as an offer or solicitation with respect to the purchase or sale of any security and are subject to change without notice. Statements in this material should not be considered investment advice or a forecast or guarantee of future results. To the extent specific securities are referenced herein, they have been selected on an objective basis to illustrate the views expressed in the commentary. Such references do not include all material information about such securities, including risks, and are not intended to be recommendations to take any action with respect to such securities. The securities identified do not represent all of the securities purchased, sold or recommended and it should not be assumed that any listed securities were or will prove to be profitable.
Past performance is no guarantee of future results.
PNC Capital Advisors, LLC claims compliance with the Global Investment Performance Standards (GIPS®). A list of composite descriptions for PNC Capital Advisors, LLC and/or a presentation that complies with the GIPS® standards are available upon request.
PNC Capital Advisors, LLC is a wholly-owned subsidiary of PNC Bank N.A. and an indirect subsidiary of The PNC Financial Services Group, Inc. serving institutional clients. PNC Capital Advisors’ strategies and the investment risks and advisory fees associated with each strategy can be found within Part 2A of the firm’s Form ADV, which is available at https://pnccapitaladvisors.com.
© The PNC Financial Services Group, Inc. All rights reserved.
FOR INSTITUTIONAL USE ONLY
INVESTMENTS: NOT FDIC INSURED-NO BANK GUARANTEE – MAY LOSE VALUE