Sector Review
The first quarter of 2022 provided investors with few places to find shelter as volatility surged, and both interest rates and risk premiums moved higher. Markets appeared to wake to the reality that the Fed faces a daunting task in fighting inflation, which will likely result in a pace of policy tightening not seen in decades. Meanwhile, geopolitical tensions have boiled over, with war in Eastern Europe stoking inflationary pressures due to surging commodity prices. Interest rates rose sharply across the yield curve, leading the Bloomberg Aggregate Index to a return of -5.93% (Figure 1). The Bloomberg Aggregate Credit Index generated excess returns of -1.31% as spreads repriced wider by 21 basis points (bps) during the quarter (Figure 2). Securitized sectors fared somewhat better with less negative excess returns.
Figure 1. UST Yield Curve
Interests rates rose sharply during first quarter
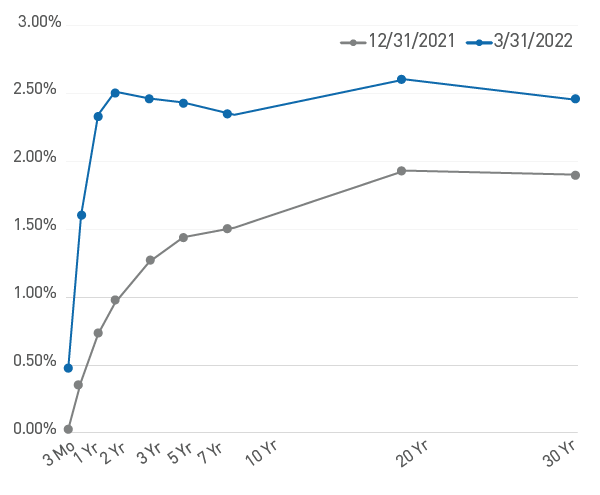
As of 3/31/2021. Source: Bloomberg L.P.
Figure 2. Sector Comparison
Spreads widened and excess returns were negative across sectors
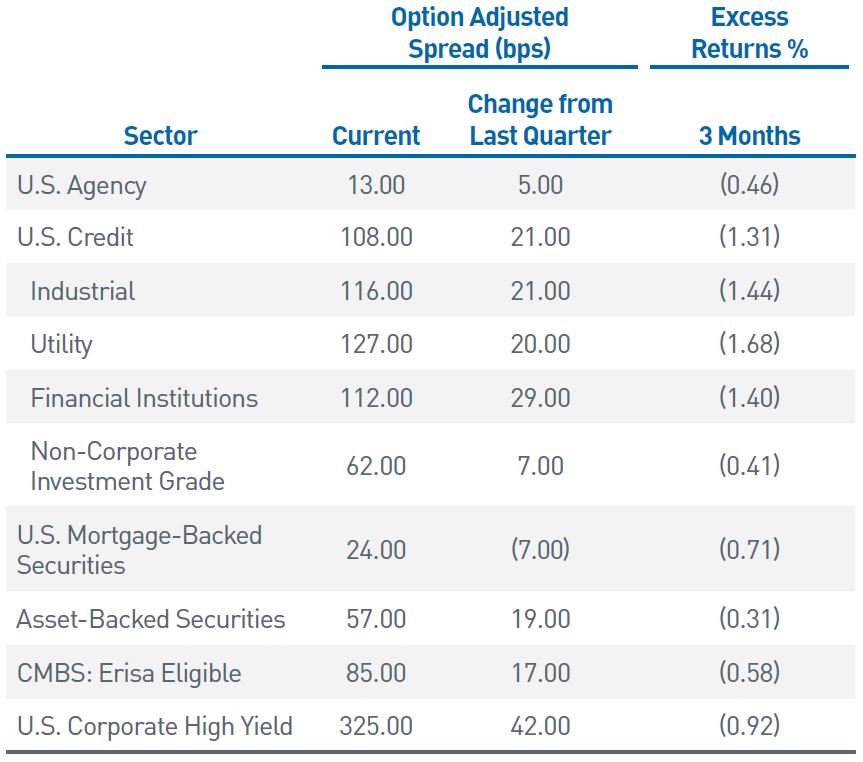
As of 3/31/2021. Source: Bloomberg L.P.
Monetary Policy: Tough talk, but will the Fed walk the walk?
The Fed used the January Federal Open Market Committee (FOMC) meeting to tee up markets for a rate hike at its following meeting in March. Sure enough, the Fed announced a 0.25%-0.50% increase in the target policy rate on March 16. The FOMC’s updated projections and the hawkish tone from Chair Powell indicated many more hikes are expected in the months ahead. The median projection on the Fed’s “dot plot” forecast indicates seven 25 bp hikes this year, up from only three hikes from the prior forecast last December. A chorus of Fed officials used recent speeches and media appearances to signal an even more hawkish tone, seemingly setting up markets for the potential of multiple 50 bp hikes. While St. Louis Fed President Jim Bullard’s “100 in the bag by July 1” comments in early February seemed aggressive, in retrospect, pandemic-induced policy accommodation measures likely should have been unwound sooner. The Fed is left in an unenviable position of fighting an uphill battle against inflation and, more importantly, needing to reestablish its credibility.
The policy tightening framework contemplated by the Fed will also address its nearly $9 trillion balance sheet, which has roughly doubled in size from the pre-COVID-19 peak. During the press conference following the March FOMC meeting, Chair Powell stated the Committee made “excellent progress toward agreeing on the parameters of the plan to shrink the balance sheet.” The minutes from the meeting noted members supported a passive runoff, with peak caps of $60 billion per month for USTs and $35 billion per month for MBS, a speed well above last cycle’s runoff. This would be phased in over the initial months of the wind-down and could potentially include outright sales of MBS once the process is underway. Also notable, in stark contrast to the last episode of quantitative tightening, the Fed’s balance sheet will likely spend just three months or less at peak levels compared to three-and-a-half years previously. Even with this more aggressive approach, the Fed’s balance sheet will remain outsized relative to domestic GDP.
With inflation continuing to “significantly exceed” its long-run goal, we expect the Fed to maintain a more hawkish posture over the next several meetings. The blunt monetary policy tools at the Fed’s disposal historically have operated with a lagged effect; aggressive policy responses are often most effective to address market panics. With significant uncertainty in the outlook and attendant challenges in forecasting economic conditions, the Fed will need to remain nimble to combat persistent inflationary pressure and engineer a slowdown in growth.
Rates and Yield Curves: Slopes, recession tropes and the straight dope
What a difference a year makes! Since reaching peak steepness of the current Fed cycle a year ago, the slope of the 2-year/10-year UST curve has flattened dramatically — even briefly inverting after the quarter’s close. The Fed’s hawkish rhetoric since late November has pushed up short/intermediate UST rates significantly, reflecting growing expectations of an aggressive tightening cycle over the next 12 to 18 months. With the fed funds target range set at 0.25%-0.50%, the front-end of the curve is remarkably steep and will adjust as Fed policy changes. Given tight labor markets and high inflation, the Fed will be challenged to engineer a soft landing for the U.S. economy. Curve inversions are oft-sighted harbingers of a recession but tend to have long lead times (12 or more months) and require persistent inversion. A better predictor is forward expectations in the UST Bill market, where, as of this writing, the curve remains steep, similar to the fed funds/2-year curve shown in Figure 3.
Figure 3. Spread Comparisons, bps
Front-end curves are historically steep, while longer-dated curves declined and briefly inverted
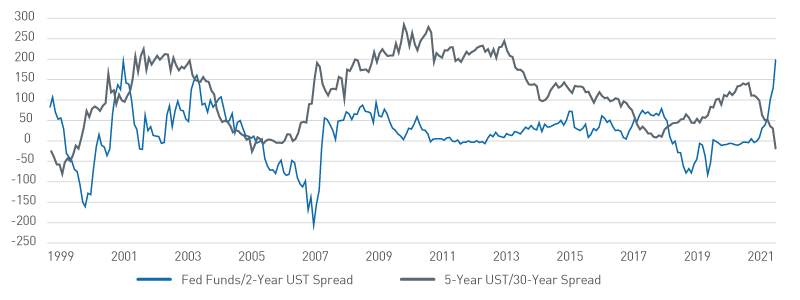
As of 3/31/2021. Source: Bloomberg L.P.
While yield curves have garnered headlines, two underlying and arguably more important developments in rates markets are influencing our risk positioning. First, increasing commodity prices drove real rates lower as breakeven spreads rose and the 10-year Treasury Inflation-Protected Securities (TIPS) real yield broke through -1% in early March. However, recent breakeven spreads have moderated, and the shift in yields during March has driven the TIP real yield through -20 bps. Real rates have spent most of the last two years below zero due to the Fed’s extraordinary accommodation. As real rates rise, financial conditions will tighten and potentially slow growth.
Perhaps even more notable is the evolution of interest rate volatility. The ICE BofA MOVE Index has been in an uptrend since the end of third quarter 2021 as markets adjust to a new Fed policy regime. The index spent most of March at levels over 100, implying daily interest rate changes of more than 6 bps. The 50-day moving average crossed 100 to start the second quarter — an event that has not happened since late 2011/early 2012 during the European sovereign debt crisis. This has contributed to recent underperformance of agency MBS. Additionally, this dynamic has historically coincided with periods of market stress (e.g., the Global Financial Crisis and the dot-com bubble, among others) and Fed regime changes.
Positioning & Outlook: In Like a Lion...
Tightening financial conditions and elevated volatility are our primary near-term concerns. We entered 2022 with more defensive positioning in client portfolios due to headwinds from the four primary factors that guide our risk-focused investment process — monetary policy, fiscal policy, inflation and volatility.
Preceding the March FOMC meeting, Credit reached a year-to-date negative excess return of 330 bps. However, this quickly reversed as the index option-adjusted spread subsequently narrowed by almost 30 bps in the final weeks of the quarter (Figure 4). Heavy supply during the quarter pressured spreads wider and created better opportunities as concessions (spread discounts to the secondary market) widened. We were active in both primary and secondary markets, adding risk as valuations improved and then actively selling as we exited the quarter given the velocity of the rally. We expect periods of episodic volatility to persist, which should present opportunities to tactically reposition client portfolios when risk/reward symmetry improves.
Figure 4. Average Option-Adjusted Spreads Comparison
A late-March rally helped offset widening spreads during the quarter
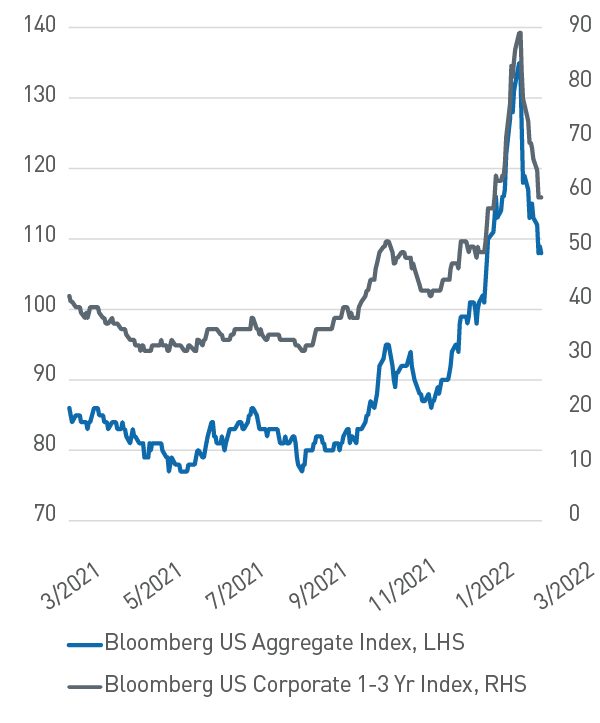
As of 12/31/2021. Source: Bloomberg L.P.
In Structured products, ABS fared better than Credit overall but weakened during March, which allowed us to increase allocations to the sector given better relative value opportunities based on historical risk/return characteristics. The Agency MBS market underperformed USTs as rates and volatility rose; the MOVE index exceeded 100 for much of March as underperformance persisted. With improved valuations and return symmetry, we continue to evaluate opportunities to reduce our underweight in the Agency MBS sector.
Market dynamics have shifted dramatically considering the Fed has only lifted its target policy rate by 25 bps. Financial conditions are tightening, rate volatility is elevated, and risk assets are struggling to find footing. The war in Ukraine has increased uncertainty and will likely lead to more persistent inflation in the near-term. In periods of high uncertainty, the emphasis of our strategy shifts to capital preservation. While much will depend on the dynamics of inflation and the Fed’s reaction, we believe fixed income return symmetry has improved and could once again serve as ballast against more volatile portfolio risk allocations.