First Quarter: In like a lamb, out like a lion
An absolute whirlwind start to the year ended on a positive note for fixed income investors after a sharp rally in U.S. Treasuries (UST) led to positive total returns for the first quarter. Each month seemed to have its own unique narrative that caused pronounced movements in USTs. Throughout the quarter, markets gyrated on expectations for the path of future Fed policy — hikes or cuts, depending on the month. Remarkably, extreme volatility in UST markets was not fully reflected in broader risk premiums, unlike other periods of market turmoil (Figure 1). However, idiosyncratic risks loomed large, particularly within the Financial sector, as bank failures, government rescue programs and a hastily consummated merger of two global systemically important banks whipsawed markets.
The Bloomberg Aggregate Index returned 2.96% for the quarter, marking two consecutive quarters of positive returns after last year’s vicious selloff. Despite a modest increase in credit spreads, the investment grade sector was able to achieve positive excess returns for the quarter of 0.21% (Figure 2). Structured product sectors experienced negative excess returns, with Agency MBS pressured by extraordinarily high levels of interest rate volatility and concerns about liquidations from distressed bank portfolios. Despite fragile market conditions, high yield spreads compressed, generating positive excess returns for below-investment-grade credit.
Figure 1. Fixed Income Volatility vs. Option-adjusted Spread (OAS, bps)
Volatility was significantly more pronounced in rates than in risk premiums
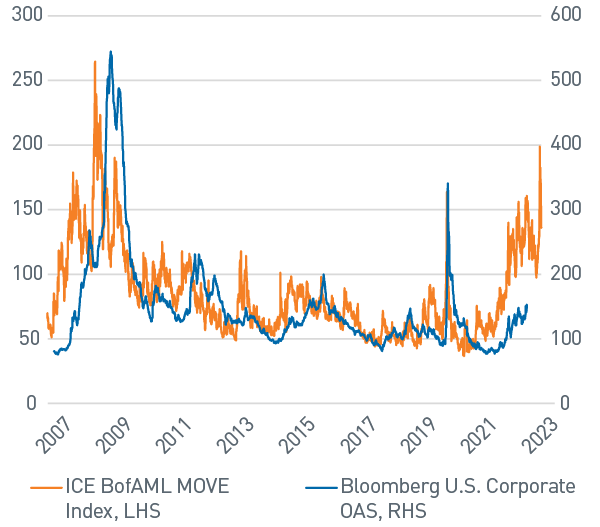
As of 3/31/22. Source: Bloomberg, L.P.
Figure 2. Sector Comparison
Performance was mixed across sectors amid a high-volatility environment
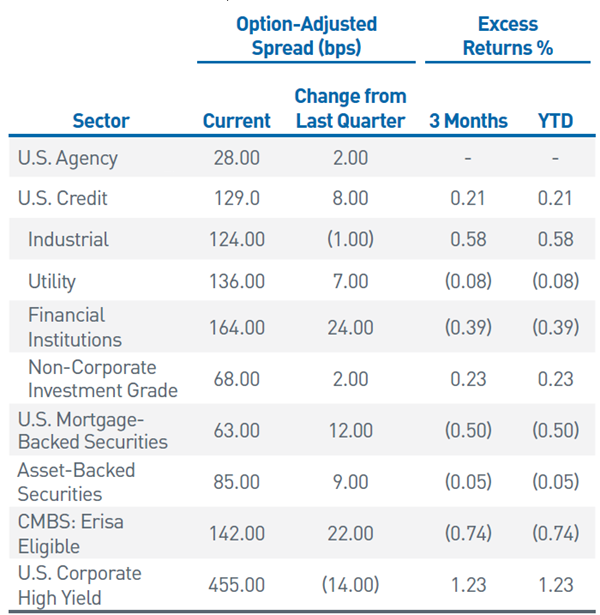
As of 3/31/22. Source: Bloomberg, L.P.
The Fed’s dilemma: Listen to the market or the data?
The Fed delivered an additional 25 bp rate hike at both its February and March FOMC meetings, bringing the target range to 4.75% - 5.00%. This marked a significant downshift in pace as hikes were 50 bps or more over the past six meetings. The FOMC’s latest economic projections were generally consistent with December’s forecasts with only modest adjustments. It is worth noting the committee’s near unanimous commitment to maintaining a policy rate over 5% throughout 2023, as well as the slight uptick in the median forecast for the end of 2024 to 4.25%. Both projections are well above current market pricing, which plummeted during the March turmoil to reflect roughly 50 bps of cuts by the end of 2023 (Figure 3). This has resulted in a deeply inverted UST curve, with yields peaking in very short-dated money market securities and then declining rapidly within the intermediate portions of the curve.
Figure 3. Fed Funds Target Rate Projections
Fed projections are well above current market pricing
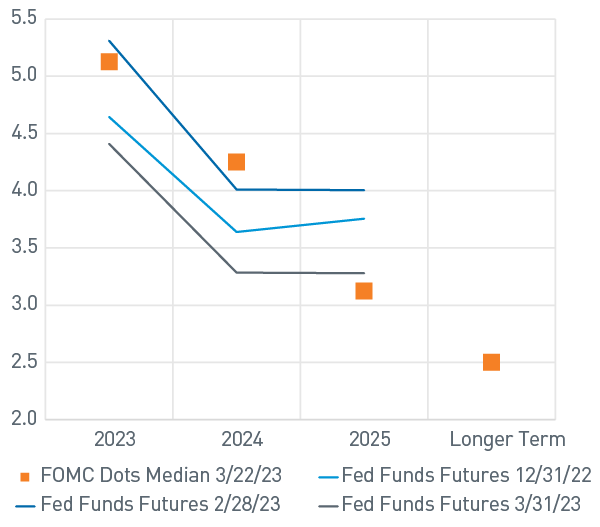
As of 3/31/22. Source: Bloomberg, L.P.
We have long anticipated episodic volatility from the lagged effects of the most aggressive monetary policy tightening campaign in a generation. As such, we believe the link between Fed policy and the failure of Silicon Valley Bank (SVB) is undeniable. We believe concerns regarding unrealized losses on high-quality government securities, resulting from rising interest rates, are what initiated SVB’s deposit flight that ultimately led to its demise.
Like the global financial crisis, markets quickly pivoted to identify other vulnerable institutions. The Fed sought to head off this contagion risk by introducing the Bank Term Funding Program, a facility to provide liquidity to banks at favorable terms, enabling them to avoid realizing losses on held-to-maturity securities. When combined with more traditional avenues for liquidity, such as the Fed’s discount window and borrowing from the Federal Home Loan Bank system, banks were able to alleviate near-term pressure. Regional banks remain in focus and trade at considerable discounts in both fixed income and equity markets. For now, the FDIC’s seizure of SVB and Signature Bank are considered idiosyncratic events.
Of greater concern to global financial markets during the first quarter was the rapid deterioration of Credit Suisse, whose myriad challenges over recent quarters escalated dramatically in the week following SVB’s collapse. Potential systemic risks associated with a Credit Suisse bankruptcy was too much for policymakers to leave to chance. As a result, Credit Suisse averted disaster with an abrupt Swiss-government assisted merger with UBS. Undoubtedly, the downstream implications of a failed global systemically important bank dwarf that of a small regional lender. Despite diminished risk appetites within the Financial sector, volatility has moderated, and the market appears to be functioning normally.
With inflation stuck well above policy targets and a still-healthy labor market, the Fed finds itself in a particularly difficult position. In insolation, economic data would suggest additional policy tightening is warranted. However, Fed staff economists are now forecasting a mild recession will begin later this year, and it is difficult to handicap how the banking system stress in March will impact growth over the balance of the year. Combined with higher funding costs, it seems likely that financial conditions will tighten independent of Fed policy. Higher-frequency data are showing weakness in the domestic economy and would suggest disinflationary forces will likely prevail, providing the Fed with the opportunity to pause its tightening campaign after May’s FOMC meeting.
Uneven volatility portends potential downside risk
During the height of March’s bank panic, interest rate volatility surged to levels last seen during the global financial crisis. The 2-year UST exhibited breathtaking moves, dropping 1.18% in a five-day period, including a 60 bp drop in one day (Figures 4 & 5)! Riskier assets moved in sympathy but not nearly to the extent that often accompanies these types of dramatic market shifts.
Figure 4. Intra-quarter UST Yields
Banking industry turmoil ignited a swift yield decline in mid-March
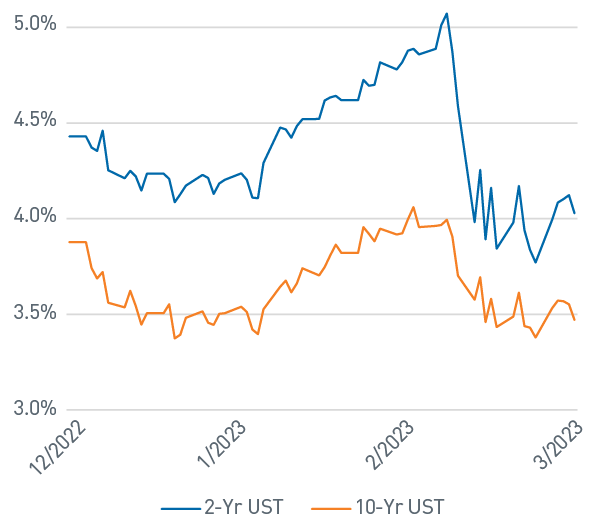
As of 3/31/22. Source: Bloomberg, L.P.
Figure 5. 2-Year UST Yield Daily Change, bps
The 2-Year UST yield dropped an astounding 60 bps on 3/13/23
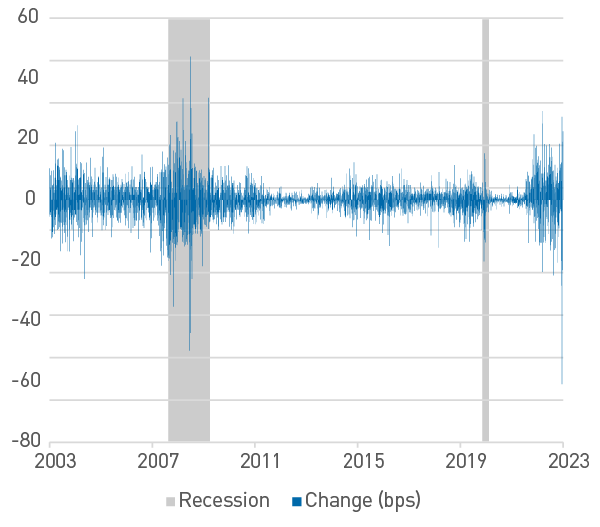
As of 3/31/22. Source: Bloomberg, L.P.
Positioning: Stay nimble, my friends
Given the rapidly evolving environment, our portfolio positioning continues to be highly tactical, an approach we employed successfully throughout much of 2022. Corporate credit risk premiums remain volatile, leading us to opportunistically add in periods of weakness and pare back during rallies. We used the selloff in March to increase weights in some higher quality financial issuers that our credit team believes are well positioned in the current environment. Additionally, credit spreads on new issuance became more attractive as issuers were required to offer higher concessions, providing opportunities to increase BBB Industrial exposure.
Given the defensive posture of client portfolios coming into March, there is still plenty of room to add credit exposure. However, we would like to see risk premiums migrate higher from current levels in order to meaningfully increase credit allocations given the recent rally. The bifurcation of valuations between Financials and Industrials is material, and rightly so, given the current environment. We will be watching this relationship closely as we determine sub-sector weights.
It is a similar story in structured products. Although ABS supply is lagging relative to 2022’s pace, pricing has been attractive in recent auto and credit card deals. Relative to opportunities in AA/A-rated Industrials, we maintain a strong bias for ABS, where valuations are considerably more favorable. In MBS we are maintaining overweights despite an uptick in volatility that has resulted in a challenged excess return profile over the last couple months. Against our F-V-T framework, MBS fundamentals and valuations remain attractive, but the technical outlook has worsened. Expected demand from banks due to improved yields has morphed into concern about potential liquidations. We expect this to be a market headwind for the foreseeable future.
Outlook: Bumpy road ahead
We are witnessing the pendulum of extraordinary fiscal stimulus reverse course. As pandemic-related stimulus monies drove excess savings to unprecedented levels, imbalances across the banking industry grew. Deposits rose considerably, while lending growth remained relatively constrained. As interest rates rose over the course of 2022, opportunities for higher yields began to disintermediate deposits at the same time banks’ mark-to-market losses on securities portfolios grew. The confluence of waning fiscal support and more restrictive monetary policy created conditions ripe for the liquidity crisis banks experienced during March — poor management and regulatory oversight aside.
It is well understood that changes in the Fed’s target rate operate with a considerable lag. With the real fed funds effective rate just recently crossing into positive territory, it is reasonable to expect financial conditions to continue tightening. More restrictive financial conditions will likely be amplified by banking sector stress, which may result in reduced credit availability and slower economic growth. While Fed board members still expected positive growth in 2023, forecasts from staff economists presented during the March FOMC meeting anticipate a recession to begin later this year. The depth and duration of a potential recession are difficult to predict. Fortunately, corporations and banks have maintained reasonably disciplined financial policies that should help them navigate a possible downturn.
We remain cautiously positioned as markets will need to reconcile valuation disparities across risk assets with Fed policy guidance and forward yields interpolated from the UST market. High-quality structured products continue to offer compelling risk/reward symmetry as current valuations look reasonably cheap on a historical basis. Conversely, the Credit sector (ex-Financials) looks generally mispriced for a weaker economic growth scenario. Much will hinge on how Fed policy adjusts to a more challenging macro environment. For now, the Fed still has work to do to ensure disinflationary forces have gained a sustainable foothold.
Indices
The Bloomberg US Aggregate Bond Index is a broad-based benchmark that measures the investment grade, U.S. dollar-denominated, fixed-rate taxable bond market. The index includes Treasuries, government-related and corporate securities, MBS (agency fixed-rate and hybrid ARM pass-throughs), ABS and CMBS (agency and nonagency).
The Bloomberg US Credit Index measures the investment grade, US dollar-denominated, fixed-rate, taxable corporate and government related bond markets. It is composed of the US Corporate Index and a non-corporate component that includes foreign agencies, sovereigns, supranationals and local authorities.
The Bloomberg U.S. Corporate High Yield Index measures the performance of USD-denominated, non-investment grade, fixed rate, taxable corporate bonds, including corporate bonds, fixed-rate bullet, putable, and callable bonds, SEC Rule 144A securities, Original issue zeroes, Pay-in-kind (PIK) bonds, Fixed-rate and fixed to-floating capital securities.
The ICE BofAML MOVE Index is a yield curve weighted index of the normalized implied volatility on 1-month Treasury options which are weighted on the 2-, 5-, 10-, and 30-year contracts.
Important Disclosures
“Bloomberg®” and the Bloomberg indices are service marks of Bloomberg Finance L.P. and its affiliates, including Bloomberg Index Services Limited (“BISL”), the administrator of the index (collectively, “Bloomberg”) and have been licensed for use for certain purposes by PNC Capital Advisors LLC. (PCA). Bloomberg is not affiliated with PCA, and Bloomberg does not approve, endorse, review, or recommend this material. Bloomberg does not guarantee the timeliness, accurateness, or completeness of any data or information relating to the information herein.
This publication is for informational purposes only. Information contained herein is believed to be accurate, but has not been verified and cannot be guaranteed. Opinions represented are not intended as an offer or solicitation with respect to the purchase or sale of any security and are subject to change without notice. Statements in this material should not be considered investment advice or a forecast or guarantee of future results. To the extent specific securities are referenced herein, they have been selected on an objective basis to illustrate the views expressed in the commentary. Such references do not include all material information about such securities, including risks, and are not intended to be recommendations to take any action with respect to such securities. The securities identified do not represent all of the securities purchased, sold or recommended and it should not be assumed that any listed securities were or will prove to be profitable.
Past performance is no guarantee of future results.
PNC Capital Advisors, LLC claims compliance with the Global Investment Performance Standards (GIPS®). A list of composite descriptions for PNC Capital Advisors, LLC and/or a presentation that complies with the GIPS® standards are available upon request.
PNC Capital Advisors, LLC is a wholly-owned subsidiary of PNC Bank N.A. and an indirect subsidiary of The PNC Financial Services Group, Inc. serving institutional clients. PNC Capital Advisors’ strategies and the investment risks and advisory fees associated with each strategy can be found within Part 2A of the firm’s Form ADV, which is available at https://pnccapitaladvisors.com.
©2023 The PNC Financial Services Group, Inc. All rights reserved.
FOR INSTITUTIONAL USE ONLY
INVESTMENTS: NOT FDIC INSURED-NO BANK GUARANTEE – MAY LOSE VALUE