Second Quarter Sector Review
Rising interest rates and increasing risk premiums led to another challenging quarter for fixed income investors. With inflation still at multidecade highs, financial markets continue to wrestle with the implications of a Fed that is desperately playing catch up.
As concerns grew in late June around a Fed-induced “hard landing,” UST yields retreated from their intra-quarter highs, providing some relief for bond investors. Nonetheless, returns for the quarter were generally negative across fixed income markets, with the Bloomberg Aggregate Index producing a -4.69% total return. Negative excess returns were prevalent across sectors as spreads widened (Figure 1). The Bloomberg Aggregate Credit Index generated a -2.05% excess return, while structured products fared modestly better. Given the backdrop of tightening financial conditions, lower-quality assets predictably underperformed. The Bloomberg Corporate High Yield Index had an excess return of -7.92% of for the quarter as spreads rose almost 250 bps.
Figure 1. Sector Comparison
Negative excess returns were prevalent across sectors as spreads widened
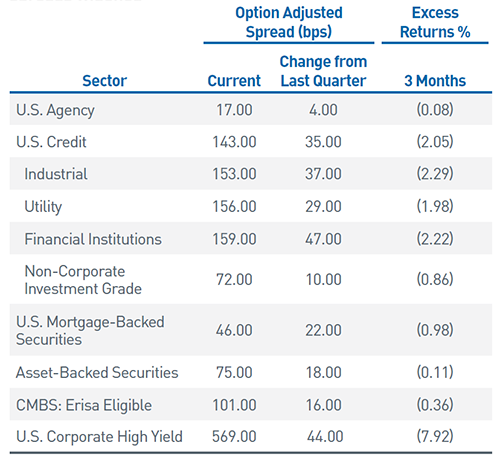
As of 6/30/22. Source: Bloomberg, L.P.
Monetary Policy: Let’s Supersize It
The Fed delivered its first 50 bp hike in 20 years at the May FOMC meeting along with the official announcement of its balance sheet runoff plan, which began on June 1. Both measures were widely expected. Ahead of the meeting, Chair Jerome Powell, along with all the regional Fed presidents, took an increasingly hawkish tone regarding the necessary speed to tighten policy.
Following the red-hot May CPI report, released just days before the June FOMC meeting, markets quickly began pricing in an even more aggressive rate hike path. The Fed followed suit with a 75 bp hike, the first hike of this magnitude since 1994, bringing the fed funds target rate range to 1.50% – 1.75%. As recently as last December, futures markets were pricing in a fed funds rate of roughly half that level by the end of 2022!
The speed at which both rate hikes have been pulled forward and the terminal rate guided higher underscores the tremendous challenge the Fed faces. With inflation spiking higher across a broadening swath of components and a labor market that continues to be extraordinarily tight, it appears likely more 50 bp-plus hikes are in the cards for the balance of 2022. As a result, investors are increasingly cautious. Recent economic data (aside from labor markets) has noticeably softened, fueling concerns that a recession will be an unavoidable outcome of the Fed’s tightening campaign.
The Fed is attempting to reestablish its credibility with both word and action. Chair Powell acknowledged the hard landing predicament during his press conference stating the Committee sees upside risks to inflation and will wait to see convincing evidence of progress before declaring victory. To tame inflation, policy will presumably need to move firmly into restrictive territory. However, it remains unclear how and to what degree the economy and markets may respond.
The latest FOMC summary of economic projections indicates slower growth in both 2022 and 2023 with only a modest increase in unemployment. Breakeven spreads on inflation-linked UST’s have dropped; the 5-year, 5-year forward inflation expectation rate — interpolated from the Treasury Inflation Protected Security curve — is back below 2.5%. Fed fund futures are aligning with the Fed’s dot plot projections, which signal the hiking campaign will be completed in 2023, quickly followed by cuts to counterbalance a weaker economy.
Tighter monetary policy and more restrictive financial conditions are now a global phenomenon. Most major central banks have moved markedly toward less accommodative policy as inflation, fueled by snarled supply chains and elevated commodity prices, affects all corners of the world. Negative yielding debt, which once exceeded $18 trillion, has fallen to approximately $2 trillion and is entirely concentrated in Japanese securities, one of the few central banks committed to accommodative policy (at the Yen’s peril). We believe this environment of coordinated central bank tightening has and will continue to contribute to volatility across financial markets. The lagged effect of monetary policy heightens the risks that central banks will not know they have gone too far until they have, necessitating caution in this uniquely new macroeconomic environment.
Credit Market Update
Interest rate volatility, as measured by the ICE BofA MOVE Index, has been elevated throughout 2022, recently approaching the highs seen during the depths of the March 2020 market dislocations (Figure 2). While broader fixed income market conditions remain healthy, persistent volatility and the weakening outlook has begun to impact credit markets.
Figure 2. ICE BofA MOVE Index
Interest rate volatility has spiked near early pandemic levels
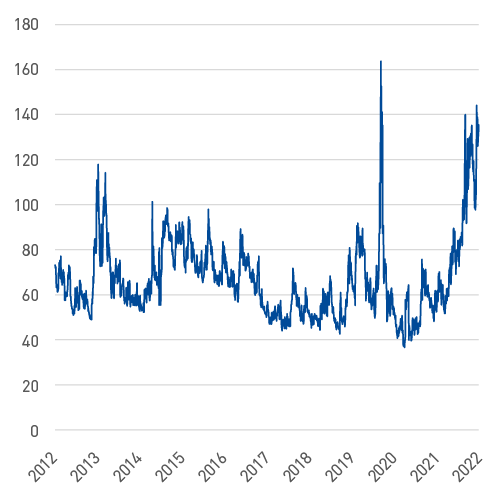
As of 6/30/2022. Source: Bloomberg L.P.
Option-adjusted credit spreads gravitated toward new cycle highs over the first half of 2022, surpassing the peak seen at the end of the last Fed hiking campaign, which triggered the “Powell pivot” in 2018. Recent spreads have generally shown a negative correlation with UST yields, which is more consistent with historic behavior. With little hope for a “Fed put” anytime soon given the inflation backdrop, riskier asset classes will have to fend for themselves during flights to quality.
Fortunately, credit fundamentals remain solid. Corporations are entering this slowdown in good financial shape with low leverage, ample liquidity and more balanced maturity profiles. Bank asset quality remains healthy with only modest deterioration among those focused on lower-quality lending. For the most part, bond-rating trends continue to be more positive than negative, particularly for Energy companies as they benefit from higher oil prices. Moving forward, we believe fundamentals may deteriorate as profit margins are squeezed and earnings expectations lowered due to elevated inflation, fractured supply chains and pessimistic consumers. We expect uncertainty to be a growing theme in coming quarters and are hyper-focused on those sectors and issuers that we expect will be best able to navigate these challenges.
Year-to-date credit market technicals have had a significant impact on risk premiums. Investment grade products have experienced almost uniformly negative investor fund flows this year, pressuring asset managers to prioritize liquidity (Figure 3). New issue supply for the first quarter was consistent with previous years but lagged materially in the second quarter (Figure 4). In recent weeks, subdued risk appetites and elevated volatility have routinely prompted issuers to avoid tapping the market or offer healthy concessions to existing debt. Many issuers can be patient given the record-breaking issuance in 2020 and the terming-out of maturity profiles in 2021. This should afford cash-rich companies some flexibility around when to issue, lowering the risk of a supply flood that could materially impact credit market valuations.
Figure 3. ICI Bond Taxable Investment Grade Estimated Weekly Net Cash Flow
Investment grade has experienced largely negative investor fund flows this year
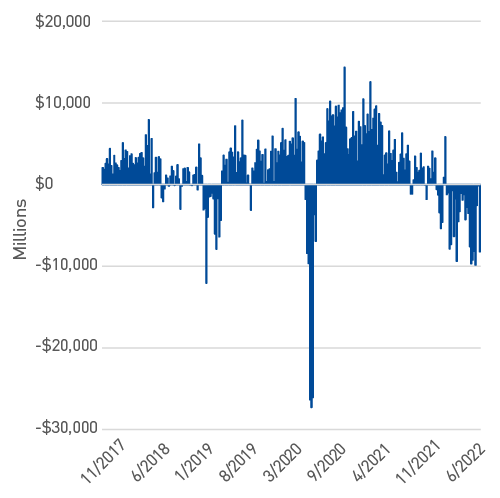
As of 6/30/22. Source: Bloomberg, L.P.
Figure 4. Total New Issuance — Investment Grade Corporate Bonds
New issue supply materially lagged in the second quarter
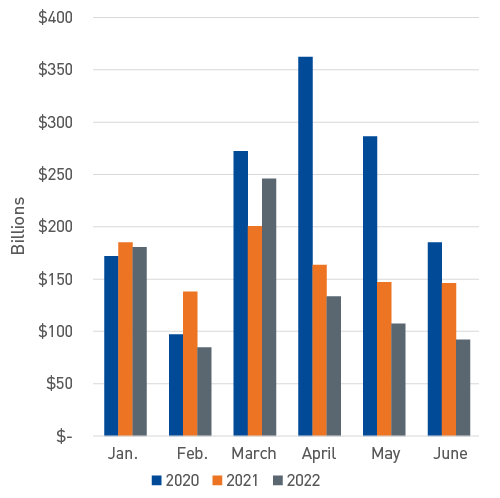
As of 6/30/22. Source: Bloomberg, L.P.
Market Outlook – Keep Calm and Carry On
Challenged technicals and concern about the potential for weakening fundamentals have created opportunities within credit as valuations materially cheapened. While we maintain a defensive bias given the deteriorating outlook, current credit spreads indicate an improved symmetry of risk-return outcomes. As market volatility continues and liquidity ebbs and flows, we believe it is prudent to maintain flexibility and opportunistically adjust positioning.
Our overweights are focused in sectors like Banking, Energy and Technology, as well as issuers we believe are best positioned to weather an economic contraction. Year to date, we have actively sought to capitalize on these opportunities while staying mindful of exit points when valuations no longer adequately compensate for incremental risk. We believe this type of tactical positioning, reinforced by our fundamental credit research, will continue to add value during this cycle.
A similar story exists within securitized markets, as risk premiums have risen for Agency MBS and ABS. Since 2021, Agency MBS has faced the specter of an eventual withdrawal of Fed support. While the Fed has quickly migrated to balance sheet runoff mode, it will continue to be a large holder of MBS given the almost $1.4 trillion of purchases made during the pandemic. Currently, outright sales are not imminent. Prepayments have slowed dramatically with the increase in interest rates as borrowers have no incentive to refinance. New supply should also remain subdued as the housing market cools. We believe these factors collectively, along with cheaper valuations, have improved the outlook for MBS. As a result, we reduced our underweight to near neutral across Aggregate strategies.
We continue to have a favorable outlook for the highest-quality AAA-rated segment of ABS, which is our singular focus within the sector. Valuations have cheapened in sympathy with wider credit spreads and are now attractive on a historical basis. We have used this opportunity to increase weights, particularly across short and intermediate styles.
As we have witnessed routinely since the Global Financial Crisis, liquidity can be fickle and can exacerbate periods of volatility. We believe liquidity risk may be heightened in coming months, a factor that continues to inform our more defensive portfolio positioning. Preserving liquidity serves our clients’ objectives during periods of increased uncertainty and provides us with flexibility to shift sector allocations as relative value changes.
Since the start of the year, we have been concerned that markets faced material headwinds across our four primary investment factors — monetary policy, fiscal policy, inflation and volatility. Challenges in the first six months of 2022 were amplified as the income component of returns was insufficient to offset the steep drop in market values associated with the rapid increase in rates. While we do not explicitly forecast expectations for interest rates, it is worth pointing out the year-to-date rise in UST yields of roughly 150–225 bps for much of the curve has dramatically improved return profile symmetry. The yield-to-worst of many investment grade indices are now at the highest levels since the Global Financial Crisis. Moving forward, improved carry profiles will have a greater influence on total returns, providing insulation for investors even if rates continue to drift higher. This dramatically improves the odds that fixed income allocations will once again provide the ballast for investors that has been lacking in recent months.