Fourth Quarter Sector Review: The Blow-by-Blow
The fourth quarter brought fixed income investors some much needed stability after an extremely challenging first three quarters of 2022. Inflation finally started to moderate, allowing the Fed some breathing room after its barrage of interest rate increases throughout the year. Market volatility subsided and risk premiums narrowed as investors grew optimistic that the Fed’s tightening campaign could slow or potentially end during the first quarter of 2023.
Returns across most segments of the fixed income market were positive for the quarter. However, returns for the year ended in deeply negative territory, marking the worst-ever year for U.S. bond performance. The Bloomberg Aggregate Index returned 1.87% for the quarter versus -13.01% for the year. Investment grade credit spreads compressed 26 bps during the quarter, generating an excess return of 2.68%. Similarly, in high yield markets, spreads compressed 83 bps, leading to an excess return of 3.05%. Structured products were mixed; agency-backed MBS outperformed with an excess return of 1.06%, while ABS had an excess return of -0.20% (Figure 1).
Figure 1. Sector Comparison
Most sectors produced positive excess returns for the quarter
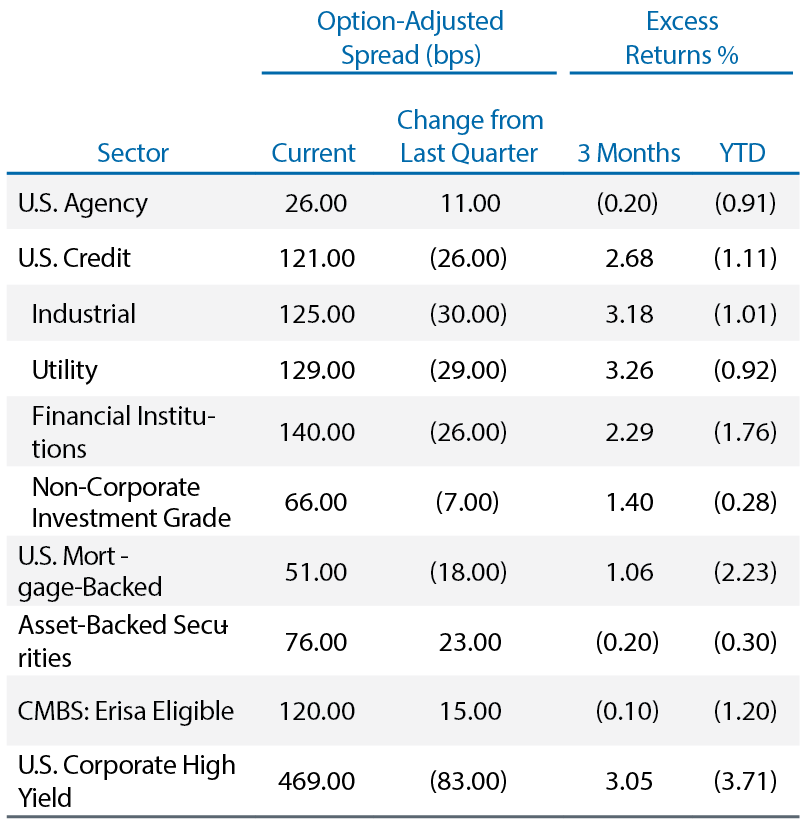
As of 12/31/22. Source: Bloomberg, L.P.
Monetary Policy: Inflation Down but not Out
After two additional fed funds rate hikes at the November and December FOMC meetings, the policy rate target range of 4.25% - 4.50% is now at the highest level since the fall of 2007. Additionally, the Fed has hiked rates by 50 bps or more at six consecutive meetings, making it the fastest tightening cycle since the early 1980s (Figure 2). The latest FOMC forecasts now indicate expectations for a higher target rate during 2023 - 2025, with a median peak rate of 5.125%. It is worth noting FOMC member forecasts were somewhat consistent, particularly for 2023, as only two of the 19 members forecasted a policy rate under 5% at year-end. The median 2023 projection is higher than implied market pricing as investors continue to expect rate cuts during the second half of the year. Chair Jerome Powell pushed back against this narrative during the latest post-FOMC press conference, stressing that rate cuts will only occur when the Fed has a high level of confidence that inflation is moving toward its 2% target. Despite a drop in recent inflation data, the Fed once again raised its projections for both headline and core PCE at the end of 2023 to 3.1% and 3.5%. This indicates insufficient progress — from the Fed’s perspective — to support the policy pivot that financial markets so optimistically anticipate.
Figure 2. Historical Fed Rate Hiking Cycles
The current hike cycle is the fastest since the 1980s
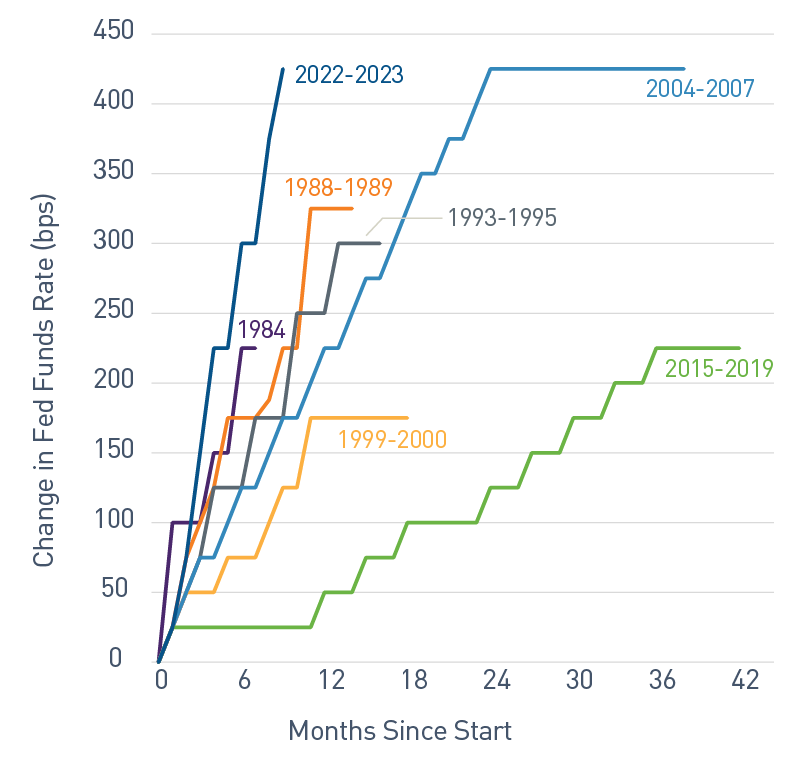
As of 12/31/22. Source: Bloomberg, L.P.
Labor markets continue to complicate matters for the Fed as virtually all measures point to tight conditions, risking a potential wage-price spiral. Payroll figures remain robust for this stage of the recovery, with the unemployment rate continuing to hover at cycle lows despite deteriorating broader economic data. The labor force participation rate remains subdued, despite elevated average hourly earnings, with job openings exceeding available workers by a factor of more than 1.5 times. In a recent speech, Chair Powell remained hawkish, stating, “Restoring price stability when inflation is high can require measures that are not popular in the short term.”1 The Fed’s efforts to engineer a soft landing will be complicated by high residual excess savings — almost $1 trillion! — which continue to fuel consumer spending and propel economic growth, albeit at a slowing rate.
Other global central banks also continue to aggressively tighten policy as they struggle in their own respective battles to control inflation. Even the uber-dovish Bank of Japan took a step toward normalizing policy by expanding the band of yield curve control on its 10-year government bond from +/- 25 bps to +/- 50 bps. While the actual policy rate remains negative, the move sent Japanese yields higher. Following this adjustment, global negative yielding debt, which exceeded $18 trillion in late 2020, now consists of just a handful of very short-dated Japanese government bonds.
Portfolio Positioning: Bobbing and Weaving
Like the first three quarters of the year, we took a tactical approach to portfolio positioning as we sought to optimize allocations amid an environment of rapidly changing valuations. Within corporate credit, risk premiums were quite attractive at the start of the quarter, with credit spreads touching the highest levels since the spring of 2020. We increased our allocations to corporate credit, both in terms of market value weight and from a contribution-to-duration perspective, by extending the maturity profile in sectors and issuers that offered steep spread curves. This opportunity was short lived as spreads compressed by more than 30 bps from late October through November (Figure 3). Given the weakening economic outlook and an unwaveringly hawkish Fed, we used this rally as an opportunity to pare back our credit exposure in the second half of the quarter. We found this to be a reliable playbook in the higher volatility environment that helped lead to outperformance across our Broad Market strategies despite virtually all sectors and benchmarks realizing negative excess returns during the year.
Figure 3. Option-adjusted Spread (OAS) Comparison
Spreads compressed significantly during November
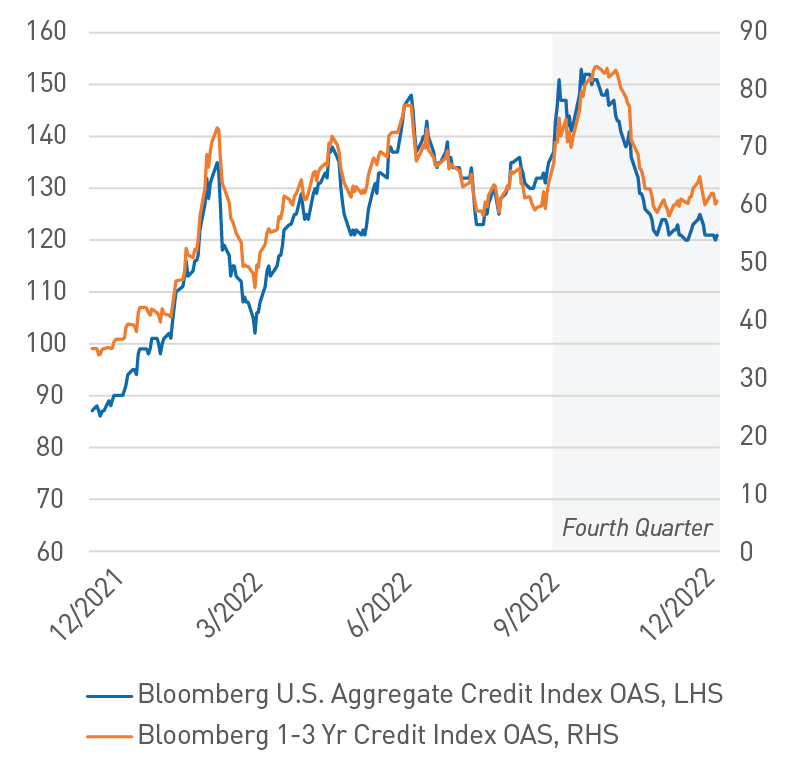
As of 12/31/22. Source: Bloomberg, L.P.
Agency MBS underperformed for much of the year as the combination of persistently high interest rate volatility, Fed balance sheet runoff concerns and diminished demand from commercial banks and sovereign buyers negatively impacted spreads. We used pressure from these headwinds to act opportunistically, moving from an underweight position in agency MBS in the first half of the year to an overweight, an allocation we maintain as of this publication. MBS has responded favorably to the recent stability in rates and moderation in volatility. In fact, by mid-January 2023, the trailing 12-month excess return rose more than 300 bps from the mid-October nadir. As a more defensive, high-quality risk allocation, we believe the MBS sector offers compelling risk/return characteristics, particularly during periods of elevated uncertainty.
Lastly, it was a comparable story in ABS. Valuations cheapened significantly in the fall as risk appetites faded and new issue supply surged. We used this opportunity to increase weights across strategies in both AAA-rated auto- and credit-card-backed issuers. While corporate credit and MBS experienced most of their outperformance in November, ABS rallied in December as the wave of new issuance ebbed and supply/demand imbalances lessened. Heading into the new year, we believe ABS valuations remain attractive. We continue to carefully assess issuer fundamentals by following delinquency and charge-off trends given the weakening economic environment, but to date, we have not seen a meaningful deterioration in the underlying collateral from prime issuers, which are our singular focus.
These valuation gyrations were routine in 2022. We believe elevated volatility will persist during 2023, which could provide opportunities to use our risk-focused investment approach to continue optimizing client portfolio positioning.
Outlook: Round One Goes to the Fed
The Fed faced the unenviable task in 2022 of needing to demonstrate its resolve and establish credibility in the fight against broad-based inflation. To do so required embarking on a relentless path of monetary policy tightening, regardless of the potential negative impact on economic activity. Global developed market central banks followed suit as ongoing challenges from disrupted supply chains for both goods and commodities pressured inflation, while fiscal stimulus tailwinds waned. The damage to investor portfolios was both material and widespread; there were scant opportunities for either positive or excess returns last year. While we believe we are nearing the end of the Fed’s rate hike campaign, investors will be well served to remember the investing 101 axiom “Don’t Fight the Fed.” Monetary policy operates with a lag and it will take time for both the Fed and markets to assess the impact of the Fed’s actions thus far.
Across domestic fixed income, total return profiles are more favorable given the attractive symmetry of potential returns based on the current interest rate environment. Recession odds are high, in our view, due to more restrictive monetary policy and elevated geopolitical risks, which should foster an environment where investment grade fixed income can once again be a source of portfolio ballast.
Like the beginning of last year, the four pillars that form our market outlook — monetary policy, fiscal policy, inflation and volatility — all present headwinds for the economy in 2023. While the pace of policy tightening will most certainly slow, the Fed has stated unequivocally it expects rates to remain higher for longer in order to uproot the price pressures that are keeping inflation well above its 2% long-term target. As the Fed continues to wind down its balance sheet, we believe, at a minimum, the ongoing withdrawal of liquidity will result in elevated pockets of market volatility for the foreseeable future.
More importantly, we are once again gearing up for contentious negotiations around the federal budget deficit and a looming debt ceiling showdown that could make 2011 look like a pillow fight. Our guard is up and we will focus on our footwork to move tactically when market opportunities arise. We are maintaining a more defensive portfolio position, emphasizing high-quality structured products and playing rope-a-dope as markets take swings at the timing of a Fed policy pivot.
1 - U.S. Federal Reserve. Chair Jerome H. Powell: Panel on “Central Bank Independence and the Mandate - Evolving Views.” January 10, 2023.
Indices
The Bloomberg US Aggregate Bond Index is a broad-based benchmark that measures the investment grade, U.S. dollar-denominated, fixed-rate taxable bond market. The index includes Treasuries, government-related and corporate securities, MBS (agency fixed-rate and hybrid ARM pass-throughs), ABS and CMBS (agency and nonagency).
The Bloomberg US Credit Index measures the investment grade, US dollar-denominated, fixed-rate, taxable corporate and government related bond markets. It is composed of the US Corporate Index and a non-corporate component that includes foreign agencies, sovereigns, supranationals and local authorities.
Important Disclosures
“Bloomberg®” and the Bloomberg indices are service marks of Bloomberg Finance L.P. and its affiliates, including Bloomberg Index Services Limited (“BISL”), the administrator of the index (collectively, “Bloomberg”) and have been licensed for use for certain purposes by PNC Capital Advisors LLC. (PCA). Bloomberg is not affiliated with PCA, and Bloomberg does not approve, endorse, review, or recommend this material. Bloomberg does not guarantee the timeliness, accurateness, or completeness of any data or information relating to the information herein.
This publication is for informational purposes only. Information contained herein is believed to be accurate, but has not been verified and cannot be guaranteed. Opinions represented are not intended as an offer or solicitation with respect to the purchase or sale of any security and are subject to change without notice. Statements in this material should not be considered investment advice or a forecast or guarantee of future results. To the extent specific securities are referenced herein, they have been selected on an objective basis to illustrate the views expressed in the commentary. Such references do not include all material information about such securities, including risks, and are not intended to be recommendations to take any action with respect to such securities. The securities identified do not represent all of the securities purchased, sold or recommended and it should not be assumed that any listed securities were or will prove to be profitable.
Past performance is no guarantee of future results.
PNC Capital Advisors, LLC claims compliance with the Global Investment Performance Standards (GIPS®). A list of composite descriptions for PNC Capital Advisors, LLC and/or a presentation that complies with the GIPS® standards are available upon request.
PNC Capital Advisors, LLC is a wholly-owned subsidiary of PNC Bank N.A. and an indirect subsidiary of The PNC Financial Services Group, Inc. serving institutional clients. PNC Capital Advisors’ strategies and the investment risks and advisory fees associated with each strategy can be found within Part 2A of the firm’s Form ADV, which is available at https://pnccapitaladvisors.com.
©2023 The PNC Financial Services Group, Inc. All rights reserved.
FOR INSTITUTIONAL USE ONLY
INVESTMENTS: NOT FDIC INSURED-NO BANK GUARANTEE – MAY LOSE VALUE