Sector Review
Volatility returned to fixed income markets in the fourth quarter after an extended period of tranquility. Already high inflation measures increased further, forcing the Fed to acknowledge the persistency of price increases and walk back its “transitory” narrative. Interest rate volatility spiked as markets recalibrated monetary policy expectations by pulling forward the timeline on both the end of Fed asset purchases and the initiation of rate hikes. While short rates increased in sympathy with Fed expectations, longer-term rates moved lower, allowing the Bloomberg Aggregate Index to eke out a positive 0.01% return for the quarter. In the latter half of the quarter, credit spreads widened as borrowers continued to issue debt at a rapid clip. News of the Omicron variant also hindered risk appetites. However, spreads partially recovered over the final weeks of December as a more optimistic tone emerged across financial markets, leaving most investment grade sectors with only modestly negative excess returns (Figure 1).
Monetary Policy: Will the Fed’s Bark be Worse Than its Bite?
The Federal Open Market Committee (FOMC) started its pivot toward less accommodative monetary policy in the third quarter but rapidly accelerated its pace throughout the fourth quarter as economic data indicated a risk of falling behind the curve. Inflation ticked higher as pricing pressures broadened well beyond pandemic-related disruptions. Meanwhile, the labor market continued to improve, with many industries still wanting for sufficient staffing levels, creating tight labor conditions. In response, at its November meeting, the FOMC announced it would start to taper asset purchases by $15 billion per month only to double that pace at the following meeting to $30 billion per month. At the current trajectory, purchases are set to conclude by March 2022, allowing the Fed greater flexibility to consider withdrawing other policy accommodation. To that point, the FOMC’s December forecast for the fed funds rate revealed a consensus for rate hikes to begin in 2022, with the median forecast indicating three increases during the year.
Figure 1. Sector Comparison
Spreads recovered ground in December, leading to only slightly negative returns for the quarter
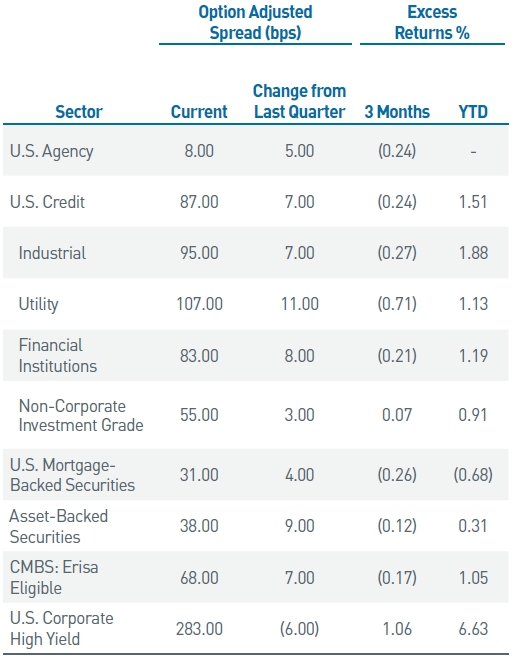
As of 12/31/2021. Source: Bloomberg L.P.
The speed at which the Fed has had to adjust its outlook illustrates the rapid pace of the economic recovery and how unique it is from prior cycles. Minutes from the December FOMC meeting reflect this, with members already debating the timing and pace of reducing the Fed’s asset holdings. Given the massive increase in the Fed’s balance sheet since March 2020 (it has doubled in size, up $4.6 trillion) combined with positive economic trends, FOMC members appear to have put aside any concerns about a potential taper tantrum like the market experienced in 2013 (Figure 2). To date, financial markets have signaled a willingness to accept a less accommodative Fed, but we would not be surprised to see turbulent conditions in the coming year if the Committee pushes too far on policy tightening.
The Fed’s sense of urgency has caused interest rates to continue to move higher; however, inflation-adjusted yields remain deeply negative, reflecting the impact of massive monetary stimulus on financial conditions over the past couple years (Figure 3). We believe the state of real yields illustrates the need for a significant recalibration in monetary policy even if inflation measures moderate as expected later in 2022.
With President Biden renominating Jerome Powell as Fed chair along with nominating current Fed governor Lael Brainard to vice chair, the potential for consistency in leadership should provide some clarity. However, with three open vacancies on the Fed’s Board of Governors and a rotation in the committee’s voting members, there is still some uncertainty regarding the Board’s composition and whether the majority would favor a more hawkish or dovish policy stance. Nonetheless, recent comments from even the most dovish members suggest all are rowing in the same direction toward tighter policy in 2022. A change in policy appears increasingly likely to occur at the March FOMC meeting as the futures market now largely anticipates a hike in the policy rate to a target of 25 – 50 basis points (bps). This has been a rapid and fluid shift as just a couple months ago market-based odds were essentially zero for a March rate hike.
Inflation: Pressure Cooker, Is There a Relief Valve?
The broadening of inflationary pressures beyond COVID-19-sensitive categories forced the Fed to retire its “transitory” narrative and acknowledge a general firming of price increases across the economy. Rental inflation has picked up over the last several months and is likely to remain elevated given recent trends in the broader housing market. Consumer demand remains robust as pent-up savings continue to support spending on goods. Growth in M2 — a broad definition of aggregate money supply — has been significant and indicates a considerable source of potential spending. Stressed supply chains and shipping bottlenecks have shown some signs of improvement but may face renewed challenges as the Omicron variant continues to spread. Meanwhile, the supply/demand imbalance across labor markets continues to pressure wages higher as employers struggle to hire and retain employees. The labor participation rate remains below pre-pandemic levels while job openings have soared, resulting in an ever-tightening job market (Figure 4). Of note, a record 4.5 million Americans voluntarily quit their jobs in November. Additionally, the employment cost index soared 1.3% in the third quarter alone, while average hourly earnings growth exceeded 4.5% annually in the second half of 2021. All these trends are showing some staying power, helping to raise short-term inflation expectations. Longer-term inflation expectations remain stable but demand watching over the coming quarter.
Figure 2. Fed Balance Sheet Assets, $ trillions
The Fed’s balance sheet has doubled in size since March 2020
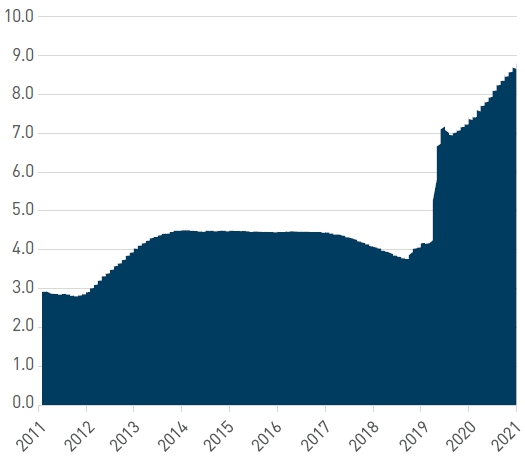
As of 12/31/2021. Source: Bloomberg L.P.
Figure 3. 10-Yr TIPS Yield vs. Inflation-Adjusted Fed Funds Rate, %
Inflation-adjusted yields remain deeply negative, reflecting easy financial conditions
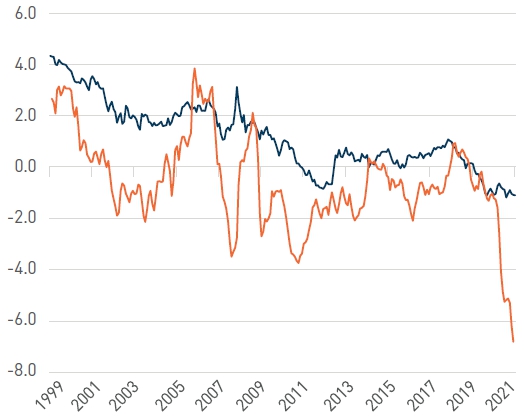
As of 12/31/2021. Source: Bloomberg L.P.
Figure 4. Labor Force Participation (%) vs. Job Openings and Labor Turnover Survey (JOLTS)
Employers are struggling to hire and retain workers, resulting in tight labor conditions
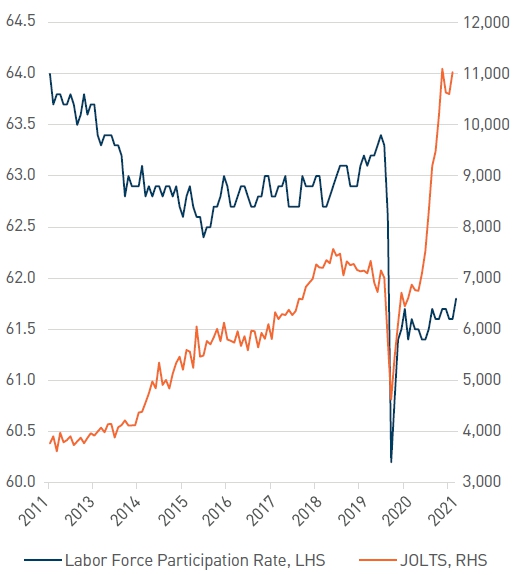
As of 12/31/2021. Source: Bloomberg L.P.
Positioning & Outlook
Prior to the fourth quarter, credit markets were relatively calm, and spreads appeared anchored at tight levels. The Fed’s pivot toward a more hawkish tone led to increased rate volatility and contributed to spread widening mid-quarter, resulting in more attractive valuations. From late November into early December, we saw opportunities to make tactical portfolio additions as spreads widened. Our focus was generally in shorter-dated, high-quality BBB- and A-rated issuers across our preferred sub-sectors in banking, energy and technology. Credit fundamentals remain favorable as corporate leverage profiles largely remain below pre-pandemic levels as companies have benefitted from unprecedented fiscal and monetary support. The rating agencies have responded accordingly, and ratings have migrated in a positive direction, reflecting improved balance sheet health. With this favorable backdrop and expectations for less new issue supply in the coming year, we will continue to look for attractive entry points to add credit exposure.
In structured products, the ABS sector experienced a similar repricing as the pace of new issuance picked up ahead of year end. With spreads having reached all-time lows during the summer months, we would be hard pressed to call valuations cheap. That said, the opportunity to add AAA-rated exposure to portfolios was compelling relative to A-rated or better credit, particularly in shorter strategies. We continue to exercise caution in agency MBS, with underweight allocations in aggregate strategies and lowered overweights in non-aggregate styles. While valuations have modestly improved, substantive changes in the Fed’s balance sheet policies could influence the delicate supply/demand dynamics of the mortgage market.
Since the Global Financial Crisis, developed market central banks have aggressively stepped in with accommodation in the face of crises yet cautiously withdrawn support during recoveries.
While emerging market central banks have been rapidly raising rates to combat inflation and weaker currencies, only in recent months have we seen a more hawkish shift in policy from their developed market counterparts. This has led to a significant reduction in the stock of negative yielding debt globally, which recently dipped below $10 trillion for the first time since early 2020.
As we look ahead into 2022, it is important to remind our clients that our risk-focused investment process begins with an evaluation of four primary factors: Fiscal Policy, Monetary Policy, Inflation Expectations and Volatility. It has been a relatively rare occurrence in the recent past where all four factors form headwinds for growth and create challenges in assessing the near-term outlook. We are now in somewhat uncharted waters as monetary policy plays catch-up to elevated inflation, tight labor markets and frothiness in riskier asset classes. We expect continued partisan politics, and the midterm election cycle will limit the ability of the federal government to provide further support for the economy. Furthermore, the Fed is embarking on a program to withdraw the extraordinary support it has supplied the economy in some measure since the Global Financial Crisis. Inflation dynamics have progressed from transitory to something potentially more insidious, raising concerns that the Fed may be “behind the curve.” All of this is likely to contribute to more periods of episodic volatility, which informs our more cautious portfolio positioning. Depending on our clients’ individual strategies, we may seek to capitalize on opportunities that arise by emphasizing sector exposure accordingly.