Third Quarter Sector Review — Uncle!
Optimism around a soft-landing scenario prevailed during the first half of the quarter, as financial markets dialed back expectations for additional tightening from the Fed. Interest rates moderated as expectations for the terminal fed funds rate fell, credit spreads narrowed and equity markets rose during July and early August. Unfortunately, a harsh reality set in by mid-quarter, as economic data failed to cooperate. Continued high inflation and firm labor market conditions gave the Fed no choice but to forcefully respond with increasingly hawkish rhetoric. By the end of the quarter, financial conditions had tightened sharply, with new highs in interest rates and credit spreads and new lows in equity markets.
These conditions led to another dismal quarter for fixed income investors, as the Bloomberg Aggregate Index produced a -4.75% total return for the quarter. The year-to-date return for the Aggregate index now stands at -14.61%, emblematic of how quickly and dramatically interest rates have surged higher this year. Investment grade credit spreads were only modestly wider for the quarter, and high yield spreads actually compressed despite new lows in equity markets. Across structured products, Agency-MBS significantly underperformed, generating -1.69% of excess returns as elevated interest rate volatility battered the sector. ABS was a source of stability as it was one of the few areas of positive excess returns across investment grade markets, aided by its shorter duration profile (Figure 1).
Figure 1. Sector Comparison
ABS was one of the few sources of positive excess returns in the quarter
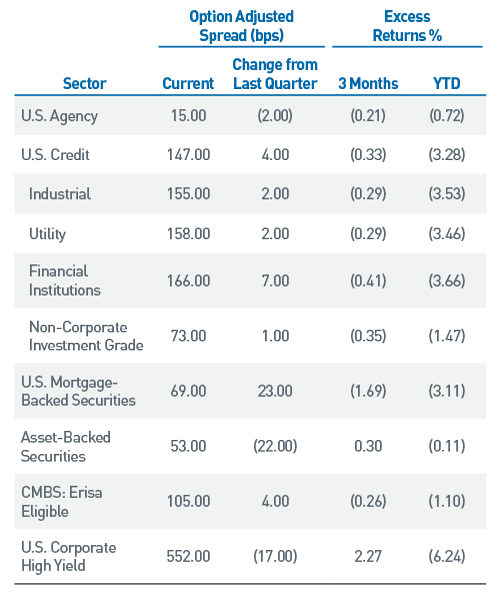
As of 9/30/22. Source: Bloomberg, L.P.
Ain’t No Party Like a Rate Hike Party, ‘Cause a Rate Hike Party Don’t Stop
With two additional 75 bp hikes of the fed funds rate during the third quarter, bringing the target rate range to 3.00% – 3.25%, the Fed is now tightening policy at the fastest pace since the early 1980s. While both increases were fully discounted in market expectations prior to each announcement, the market reaction post-meeting could not have been more divergent. Chair Jerome Powell’s messaging during his press conference following the July FOMC meeting was decidedly dovish and ran counter to the narrative outlined in the official statement. His comments related to the “unusually large” recent hikes and the consideration of labor markets and economic growth in future policy decisions were interpreted by markets as presaging a pivot to a slower pace of tightening. UST yields declined and financial conditions eased over the following weeks. Only a month later at the Fed’s Jackson Hole symposium at the end of August, Powell delivered a succinct speech that stressed the FOMC’s commitment to reducing inflation and that policy would likely need to be restrictive for some time which will “bring some pain to households and businesses.”
Subsequent economic releases have underscored the need for more restrictive policy to combat price pressures. The August Consumer Price Index report, released on September 13, was significantly higher than expected. Most alarming were core inflation measures, which were particularly firm across a wide swath of components. The market reaction was swift, as expectations for a longer tightening cycle coupled with a higher terminal fed funds rate was immediately discounted across financial markets.
As the September FOMC meeting date loomed, investors braced for more hawkish rhetoric and the Fed did not disappoint. The newly revised “dot plot” indicated a sizeable increase in the median anticipated policy rate to 4.375% by the end of 2022 and a median forecasted rate of 4.625% by the end of 2023. In addition to these upward revisions were corresponding downward revisions to projected GDP and the unemployment rate, as both were lowered by 0.50% to 1.2% and 4.4%, respectively. The projections clearly indicated a growing belief among FOMC participants that the odds of a soft landing have withered. Chair Powell said as much during his press conference as he acknowledged that “there isn’t a painless way to get inflation behind us” and that labor markets would need to soften.
The Fed’s resolve will be tested in coming months as tighter policy conditions begin to impact the economy more broadly. Market participants are eager to identify “the pivot” that would help mark a peak in yields and provide a floor for risk assets. However, with core inflation measures yet to show signs of turning, markets are discounting a terminal rate of near 5%. Fed officials continue to lean into a narrative where policy will need to remain restrictive for an extended period to ensure pricing pressures are brought under control. While the pace of increases in the fed funds rate should moderate into 2023, ongoing quantitative tightening will continue to place additional pressure on the outlook for GDP growth and labor markets.
The Fed has spent much of the last 12 months restoring credibility for being late in instituting a policy shift and will likely work hard to preserve this given the experience in the U.K. over the last few weeks. A poorly conceived fiscal policy shift from the new prime minister’s administration forced the Bank of England (BOE) to intervene in an effort to halt a stunning collapse across the U.K. bond market, requiring a pledge of unlimited purchases of long-dated bonds to halt the freefall across currency and gilt markets. Ironically, this bond buying program came just days ahead of the scheduled start date for bond sales to shrink BOE balance sheet holdings. While the ructions seen in the U.K. are an extreme example of volatility caused by conflicting policy agendas from monetary and fiscal authorities, it does serve as a cautionary example of how questionable policy decisions can roil markets in the current environment.
Liquidity Tide Receding, Volatile Rip Currents
Persistent volatility has been a hallmark of 2022. The extraordinary monetary support across developed markets for much of the last two years has helped suppress volatility and boost liquidity. Coordinated policy tightening has had the reverse effect and resulted in pockets of illiquidity across financial markets.
Moving forward, the ramifications of policy tightening on the real economy will likely be an additional source of stress as consumer and corporate balance sheets weaken. The surge in the U.S. dollar has disrupted global currency markets and led to central bank interventions, adding an additional layer of uncertainty to interest rates. In line with the Fed’s desire, financial conditions have tightened and real interest rates have moved decisively into positive territory (Figure 2 – 5).
Figures 2-5: Market reactions to the Fed’s dilemma have been swift
All as of 9/30/22. Source: Bloomberg, L.P.
Figure 2. Goldman Sachs U.S. Financial Conditions Index
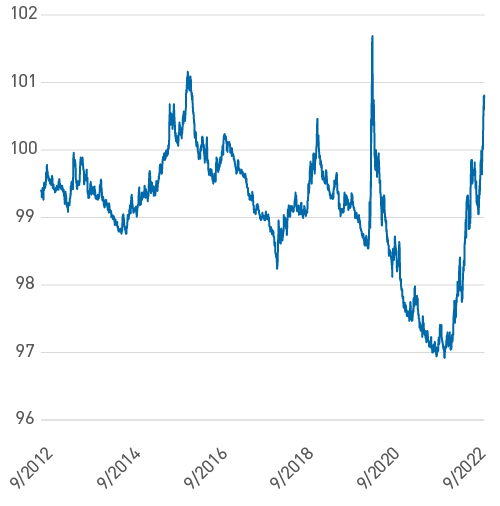
Figure 3. ICE BofAML MOVE Index
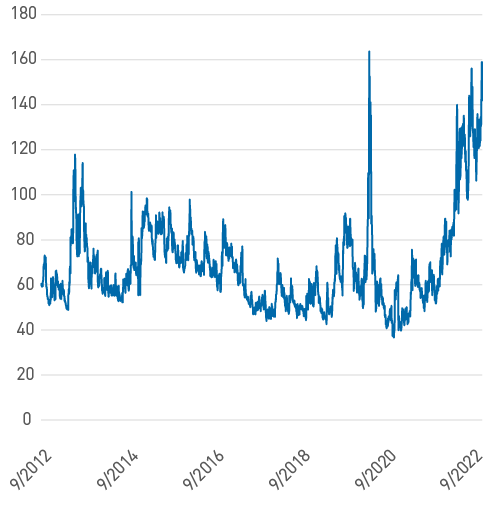
Figure 4. 10-Year TIPS (Treasury Inflation-Protected Securities) Yield
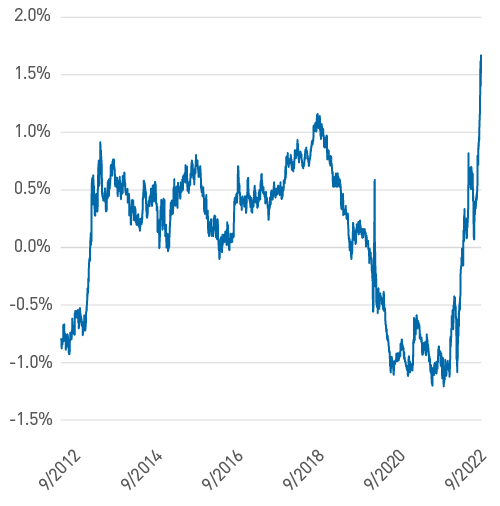
Figure 5. U.S. Dollar Index
Pondering Powell Pivots, Positioning and Premia in Risk Assets
As we have highlighted over the course of this year, market dislocations have continued to create investment opportunities, providing attractive entry points given the absolute levels of interest rates and risk premiums. Within corporate credit, spreads are at year-to-date highs. While we believe we have yet to see a peak, there are vast differences in valuations across sub-sectors. High-quality Financials have cheapened dramatically relative to similarly rated Industrials, which have only modestly repriced from extremely expensive levels. We continue to tactically position portfolios around this dichotomy, being mindful of deteriorating credit fundamentals, weak market technicals and the risk of unexpected systemic events resulting from extreme volatility.
It is a similar story in structured products, as Agency-MBS has routinely been whipsawed by both interest rate volatility and reduced institutional support as the Fed runs off its holdings through quantitative tightening. Buyers such as commercial banks and foreign sovereign funds are paring back as well. Traditional money managers are largely left to fill the void, and that has resulted in a significant repricing. Valuations are at levels seen during other periods of market stress, that have historically proved to be an attractive entry point. We entered the year underweight MBS in Aggregate styles but have recently moved to neutral-weight with an eye toward becoming overweight as opportunities allow. ABS has been more insulated than MBS and credit year to date given its high-quality nature and short duration profile. These characteristics are precisely why we emphasize structured products in portfolios, particularly when valuations are favorable relative to other highly rated alternatives in credit (see our whitepaper, The Case for Structured Securities).We continue to maintain overweights as we believe it is a defensive addition to portfolios across investment strategies.
With yields on most investment grade indices rising to the highest levels since the financial crisis, fixed income has become a materially more attractive asset class. Undoubtedly, this adjustment has been jarring for investors as repricing has occurred at a rapid pace, leading to some of the worst absolute returns year to date on record.
Entering the fourth quarter, the market environment remains highly uncertain. When reflecting on the four primary factors that form our investment outlook — monetary policy, fiscal policy, inflation and volatility — each has created material headwinds for fixed income markets as we anticipated at the start of the year. While valuations have improved across a variety of sectors from both a yield and spread perspective, Fed policy operates with a lag and we are likely just beginning to see the broader implications of its tightening campaign on the economy. At this time, we favor adding to higher-quality structured products as a means to enhance risk/return profiles over the next 12 months.
Fed funds futures now imply a terminal rate of near 5%, which is above the median derived from the Fed’s September 2022 “dot plot.” As we move into the later innings of this cycle, the symmetry of returns and probability of improved return outcomes has strengthened. The Bloomberg Aggregate Index yields close to 5% and provides a means to offset principal declines should rates continue to rise (Figure 6). As shown in Figure 7, the forward return profile from this level of yield has historically averaged more than 5.5% annually on a rolling 5-year basis. While it is natural for investors to seek safe harbor in cash given the volatility, the improved symmetry from higher yields and wider spreads will likely result in stronger return profiles in 2023. We remain mindful of maintaining ample liquidity in portfolios to take advantage of wider risk premia during periods of market stress.
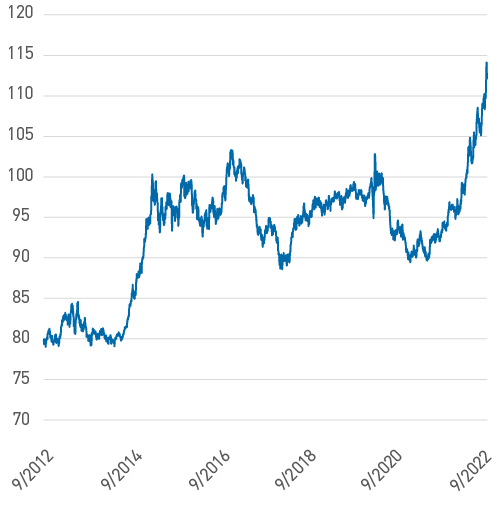
Figure 6. Bloomberg US Aggregate Index, YTW vs. Price
Yields are at levels last seen during the Global Financial Crisis
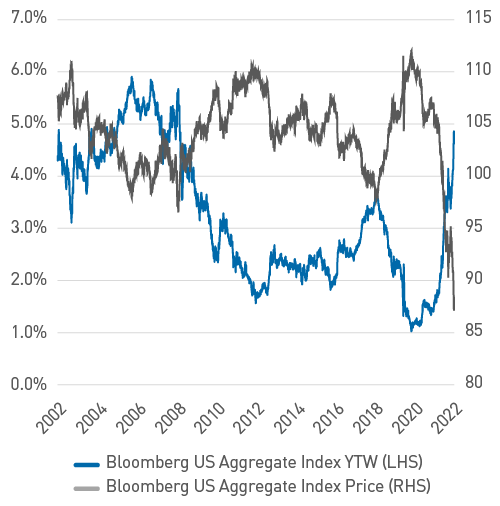
As of 9/30/22. Source: Bloomberg, L.P.
Figure 7. Bloomberg US Aggregate Index 5-Year Forward Average Annualized Returns by Starting Yield Range (January 1976-September 2022)
Yield profile has improved symmetry of returns
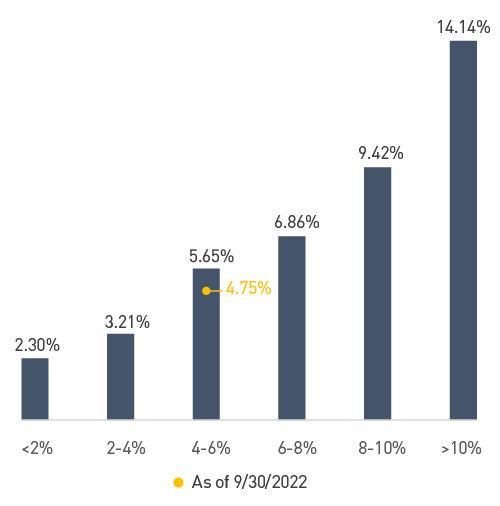
As of 9/30/22. Source: Bloomberg, L.P.
Indices
The Bloomberg US Aggregate Bond Index is a broad-based benchmark that measures the investment grade, U.S. dollar-denominated, fixed-rate taxable bond market. The index includes Treasuries, government-related and corporate securities, MBS (agency fixed-rate and hybrid ARM pass-throughs), ABS and CMBS (agency and nonagency).
The Consumer Price Index (CPI) is a measure of the average change over time in the prices paid by urban consumers for a market basket of consumer goods and services.
The Goldman Sachs Financial Conditions Index is a weighted average of riskless interest rates, the exchange rate, equity valuations, and credit spreads, with weights that correspond to the direct impact of each variable on GDP.
The ICE BofAML MOVE Index is a yield curve weighted index of the normalized implied volatility on 1-month Treasury options which are weighted on the 2-, 5-, 10-, and 30-year contracts.
The U.S. Dollar Index measures the value of the U.S. dollar relative to a basket of foreign currencies.
Important Disclosures
“Bloomberg®” and the Bloomberg indices are service marks of Bloomberg Finance L.P. and its affiliates, including Bloomberg Index Services Limited (“BISL”), the administrator of the index (collectively, “Bloomberg”) and have been licensed for use for certain purposes by PNC Capital Advisors LLC. (PCA). Bloomberg is not affiliated with PCA, and Bloomberg does not approve, endorse, review, or recommend this material. Bloomberg does not guarantee the timeliness, accurateness, or completeness of any data or information relating to the information herein.
This publication is for informational purposes only. Information contained herein is believed to be accurate, but has not been verified and cannot be guaranteed. Opinions represented are not intended as an offer or solicitation with respect to the purchase or sale of any security and are subject to change without notice. Statements in this material should not be considered investment advice or a forecast or guarantee of future results. To the extent specific securities are referenced herein, they have been selected on an objective basis to illustrate the views expressed in the commentary. Such references do not include all material information about such securities, including risks, and are not intended to be recommendations to take any action with respect to such securities. The securities identified do not represent all of the securities purchased, sold or recommended and it should not be assumed that any listed securities were or will prove to be profitable.
Past performance is no guarantee of future results.
PNC Capital Advisors, LLC claims compliance with the Global Investment Performance Standards (GIPS®). A list of composite descriptions for PNC Capital Advisors, LLC and/or a presentation that complies with the GIPS® standards are available upon request.
PNC Capital Advisors, LLC is a wholly-owned subsidiary of PNC Bank N.A. and an indirect subsidiary of The PNC Financial Services Group, Inc. serving institutional clients. PNC Capital Advisors’ strategies and the investment risks and advisory fees associated with each strategy can be found within Part 2A of the firm’s Form ADV, which is available at https://pnccapitaladvisors.com.
©2021 The PNC Financial Services Group, Inc. All rights reserved.
FOR INSTITUTIONAL USE ONLY
INVESTMENTS: NOT FDIC INSURED-NO BANK GUARANTEE – MAY LOSE VALUE