Sector Review
The reflationary narrative that dominated the early months of the year lost some momentum during the second quarter as a number of market indicators reinforced the Fed’s view that the recent surge in inflation is likely transitory. Meanwhile, the outlook for strong economic growth continues to be well supported but does face some headwinds from a shortage of a variety of input materials as well as a persistent scarcity of labor. Together these factors contributed to a noticeable flattening of the yield curve, reversing the persistent steepening trend of the prior two quarters. Consequently, the Bloomberg Barclays Aggregate Index realized a total return of 1.83% for the quarter, erasing roughly half of the negative first quarter return. Investment grade excess returns were positive during the quarter as credit spreads continued to narrow (Figure 1). However, agency MBS came under pressure and was the one sector to produce negative excess returns. Lower quality credit continued to outperform as high yield spreads tightened to new post-Global Financial Crisis lows.
Figure 1. Sector Comparison
Spreads continued to tighten across sectors
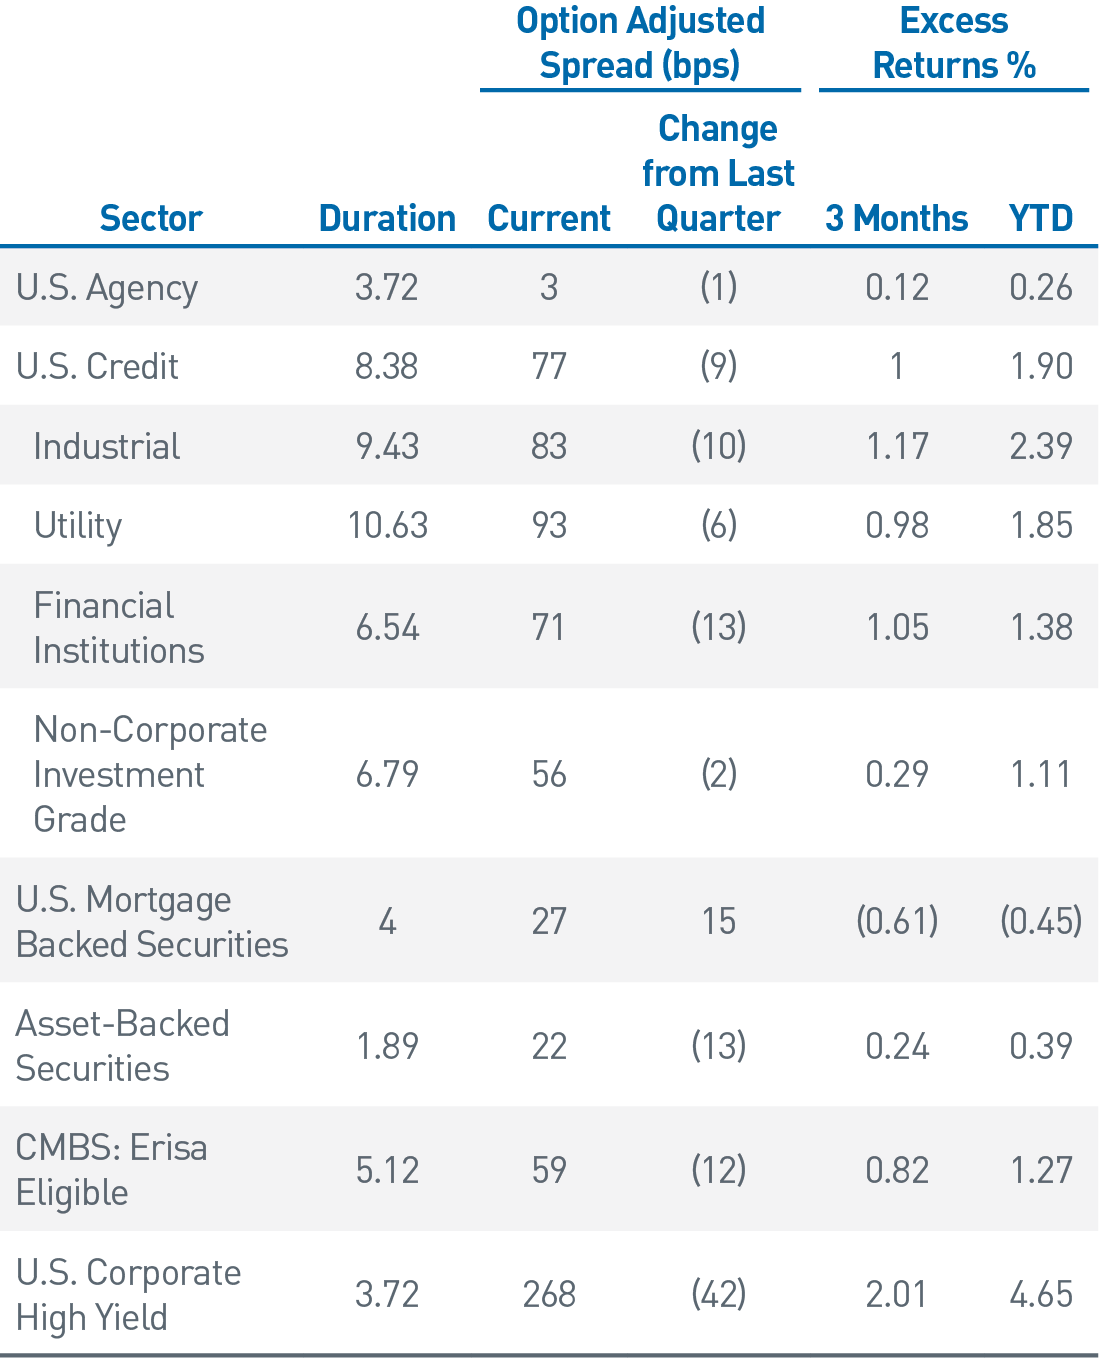
As of 6/30/21. Source: Bloomberg Barclays
Monetary Policy: Connecting the Dots
Faced with mounting evidence of an accelerating economic recovery, the Fed took a moderately hawkish pivot at the June FOMC meeting. This turn in sentiment helped alleviate concerns that the Fed might leave its extremely accommodative policy on auto pilot longer than warranted and risk overstimulating the economy. While the Fed raised its economic projections only modestly from March, FOMC members’ median interest rate forecast for 2023 now indicates two hikes, up from zero in the prior quarter (Figure 2). Additionally, Fed Chair Jerome Powell indicated the committee had begun talking about tapering asset purchases, with the caveat that actual implementation would likely still be a ways off. Although, minutes from the June meeting suggest a lack of consensus about timing, the evolution of Fed commentary in recent months suggests the program could begin winding down by first quarter 2022. Furthermore, the Fed has been very clear it has every intention of giving markets plenty of advance notice as it looks to carefully reduce the pace of UST and MBS purchases with the least amount of disruption. There has also been quite a bit of speculation among fixed income investors as to whether the Fed would begin reducing MBS purchases given the strength in the housing market. Fed minutes suggest this is an area of ongoing debate. We continue to believe an official announcement on the Fed’s tapering strategy will likely come later this year with an effective date shortly thereafter.
There were other Fed actions during the quarter that didn’t receive the same degree of focus as the dot plot and taper talk but were significant, nonetheless. At the June meeting, the FOMC raised the overnight reverse repo rate as well as the rate paid on excess reserves by 5 basis points (bps), to 5 and 15 bps, respectively. This brought welcome relief to money market and short duration investors who have been dealing with a flood of cash into short-term funding markets. Use of the Fed’s reverse repo facility has been surging in recent weeks, spiking to just under $1 trillion at quarter end. The Fed’s actions helped raise the floor a few basis points above 0.00% for the shortest government assets, but there continues to be a lack of supply to satisfy the tremendous amount of cash in money markets.
The other noticeable announcement came a couple weeks ahead of the June FOMC meeting when the Fed announced the wind-down of the Secondary Market Corporate Credit Facility. This program, which was announced at the height of the March 2020 market dislocation, proved tremendously successful in stabilizing investor nerves despite its modest use. At the time of the wind-down announcement, the Fed held approximately $13.5 billion in front-end corporate bonds and exchange-traded funds. Given the relative size of the facility and continued strong investor demand, the market took the announcement in stride. Investors will likely expect a similar rescue in future panics, a precedent that future Fed chairs will have to navigate.
Figure 2. FOMC Implied Fed Funds Target Rate Projections
Median projections now indicate two rate hikes in 2023
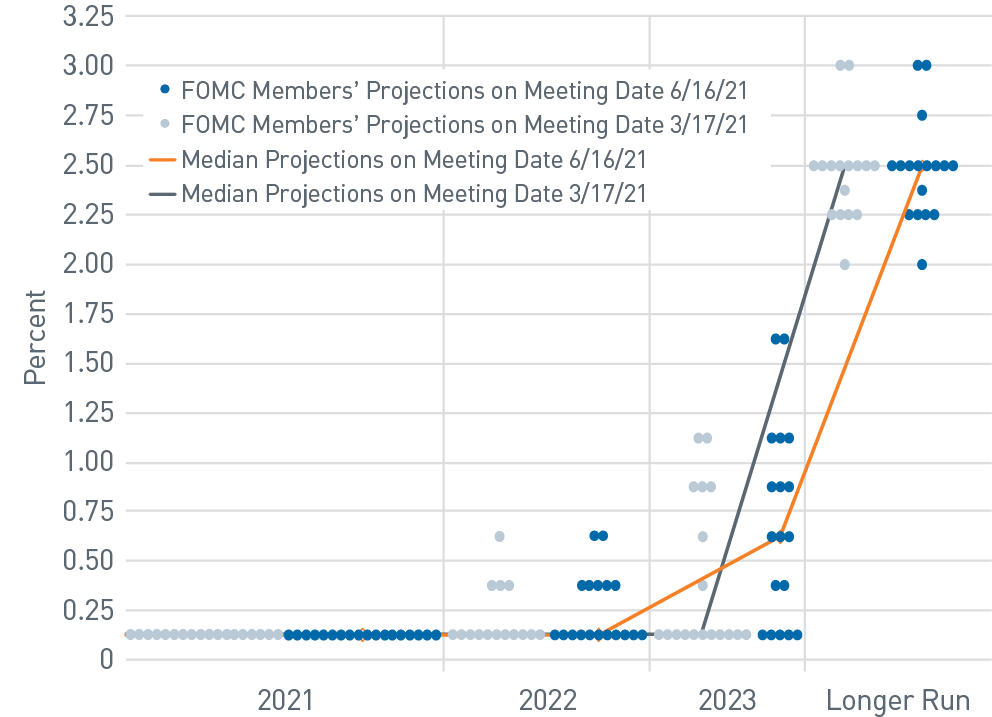
As of 6/30/21. Source: U.S. Federal Reserve, PNC Capital Advisors
Curve-Steepening Trade Flattened
UST rates steadily increased through late March while the yield curve steepened to reflect expectations of broader economic strength and higher inflation. The breakeven spread on 10-year Treasury Inflation Protected Securities (TIPS) briefly exceeded 250 bps — a level not reached since more than eight years ago.
Figure 3. 10-Year TIPS Breakeven Rate vs. 10-year – 2-year UST Yield Curve
The breakeven spread on 10-year TIPS retreated from
near-term highs as the yield curve flattened
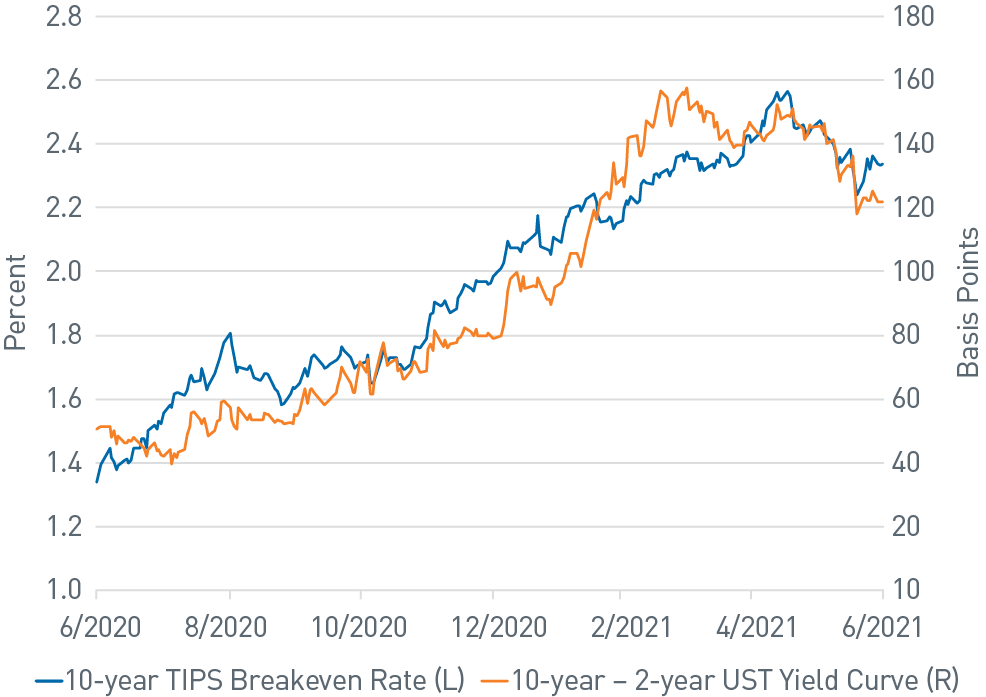
As of 6/30/21. Source: Bloomberg L.P.
With improving vaccination rates and broader mobility, the labor market made significant gains in May and June. Improving economic activity has created supply chain stress and resulted in higher inflation; as widely expected, the Consumer Price Index (CPI) and Personal Consumption Expenditure (PCE) index spiked during the spring and will likely remain elevated over the near future. The Fed continues to emphasize its expectation that the primary drivers of increased inflation will prove transitory.
During the second quarter, however, many investors were surprised as UST rates moved decidedly lower while the breakeven spread on TIPS fell. In fact, the real yield on 10-year TIPS recently traded below -1% (Figure 3). A number of factors are at play, including concerns about longer-term growth, delays in additional fiscal stimulus, a subtle shift in the Fed’s tone of ongoing accommodation and the spread of the COVID-19 delta variant. As discussed in our recent commentary, periods of significant negative excess return for the Barclays Aggregate have historically been followed by improved performance over subsequent quarters. We would also note that the stock of negative yielding debt globally remains elevated at more than $14 trillion and lends support to the still comparatively attractive yields in the United States.
Portfolio Positioning: Focus on Tactical as Relative Value Scarce
Credit markets were remarkably stable in the second quarter, with spreads grinding tighter to levels that are currently extremely expensive on a historical basis. With relative value opportunities increasingly difficult to find, we have generally focused on tactical repositioning across strategies to optimize exposures. Modest reductions in top-performing subsectors and further trimming of high-quality front-end issuers was the general theme in intermediate and core strategies. While new issue supply continued at a robust pace, we largely focused on secondary markets when adding to portfolios given slim (or non-existent) new issue concessions and a calendar dominated by less liquid off-the-run credits.
In structured products, we maintained an underweight to Agency MBS in aggregate strategies, which benefited relative performance as mortgages continue to lag other investment-grade sectors. Potential volatility in the sector associated with the Fed’s eventual taper may present an opportunity to add to mortgages later in 2021. In short duration strategies, we continue to hold an overweight in defensive 10-year and 15-year pools but have modestly reduced the allocation. Elsewhere in the securitized markets we have maintained weights in consumer asset-backed securities through the modestly active new issue market. Despite expensive valuations, we have seen relative value in the sector compared to other high-quality front-end alternatives.
In core and intermediate strategies, we initiated a position in shorter-maturity TIPS as valuations improved and provided an attractive entry point. In our view, this was an opportunity to capture excess return given supply chain and labor shortages. We also expect a positive carry profile in the summer months due to an expected continuation of strong monthly headline CPI prints. While April and May CPI were led by the rebound in airfare, hotel and used car prices, factors such as housing and energy should keep CPI elevated in the near term.
Heading into the third quarter, we aim to maintain flexibility in client portfolios to accommodate increased risk exposure should market volatility lead to compelling investment opportunities. Given strong market technicals and relatively expensive valuations across credit, we believe issuer and security selection are paramount. As our experience from numerous recent periods of prolonged low volatility has taught us, a placid market environment can be quickly disrupted by shifting monetary policy agendas.