Investment grade bonds are typically considered an avenue for capital preservation, income generation and diversification given their traditionally lower risk profile relative to other asset classes, such as equities. While investment grade comprises BBB-rated securities (BBBs) and above, we regularly encounter client investment policy statements that winnow the investment grade-universe down to only A-rated and above in an attempt to limit risk. Although well intentioned, we believe avoiding BBBs altogether, introduces unforeseen risks. Based on our analysis, avoiding BBBs can result in unwanted exposures and/or increased risk of underperformance due to lack of diversification, when in fact, BBB-rated credit often offers compelling opportunities on a risk-adjusted basis.
Before limiting the investment universe to exclude BBBs, we believe investors should consider the following:
- The proportion of BBB-rated securities in the Bloomberg U.S. Corporate Bond Index has declined in recent years but still constitutes approximately 45% of the index as of February 2026.
- Limiting portfolio quality to A-rated or higher changes the diversification of the investment universe as BBB credit includes additional sector opportunities.
Excluding portions of the investable universe could lead to unintentional over- or under-exposure to exogenous factors.
- Many BBBs are issued by familiar, established companies with significant market capitalizations.
Maintaining a diversified portfolio is a key tenet of our corporate credit allocation process. We also believe identifying and investing in securities with favorable risk-reward attributes supports greater return consistency through economic cycles. Because BBB-rated securities largely provide adequate compensation for their added volatility risk, in our experience, the selective addition of BBBs can improve a portfolio's expected risk-return profile. Like any investment, knowing what you own by performing proper due diligence is key.
We're Living in a BBB World
To understand the potential impact of excluding BBB-rated bonds from a portfolio, the modern ubiquity of such investments must be considered. Over the last decade, the market value of the Bloomberg U.S. Corporate Bond Index has grown by almost 70% in par value outstanding, during which time, the credit quality of the index has shifted toward BBB-rated issuers. In fact, as of February 28, 2026, approximately 45% of the index is rated BBB (Figure 1). As a result, excluding BBBs could constrain the available investment options in Corporate Credit.
Figure 1. Bloomberg U.S. Corporate Bond Index Quality Migration
BBBs as a percent of par value have increased throughout the last decade
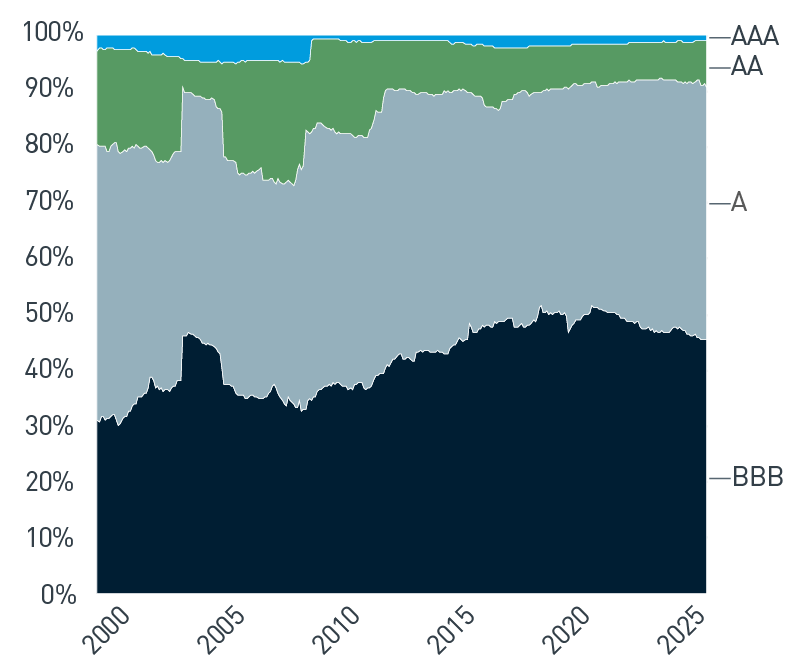
As of 2/28/2026. Source: Bloomberg, L.P. View accessible version of chart.
Within a given rating category, sector diversification can vary significantly. Portions of certain sectors such as telecommunications, energy and healthcare are unavailable if a portfolio's minimum quality is restricted to A-or-better-rated issuers. Excluding BBBs from a portfolio's Credit allocation concentrates issuers in the Financials sector (Figure 2). This is exacerbated in short-duration mandates as nearly 60% of the 1- to 3-year A-or-better index is represented by Finances (Figure 3).
Figure 2. Bloomberg U.S. Corporate Bond Index by Quality and Sector
Portfolio diversification becomes more limited when excluding BBBs
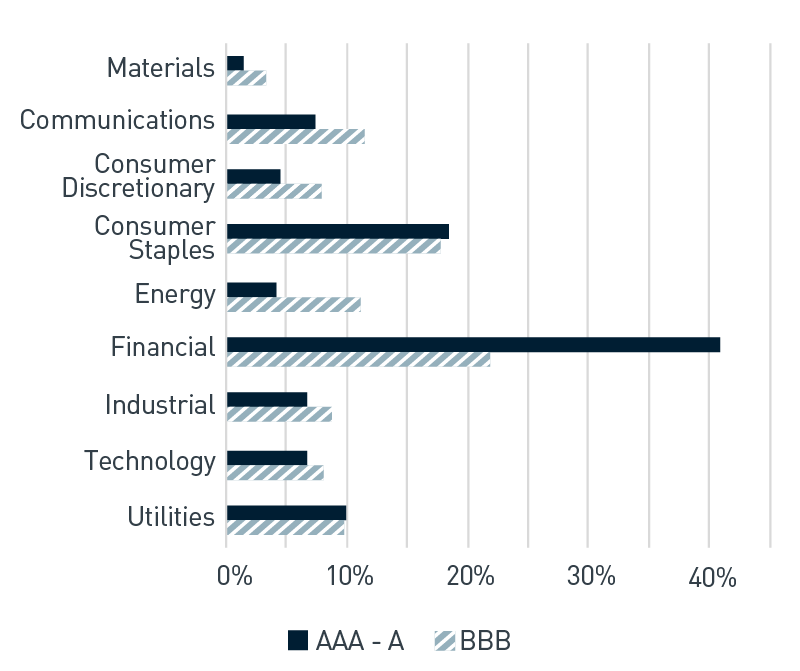
As of 12/31/2025. Source: Bloomberg, L.P. View accessible version of chart.
Figure 3. Bloomberg 1-3 Year U.S. Corporate Bond Index by Sector
Sector concentrations by quality are exacerbated in short-duration cohorts
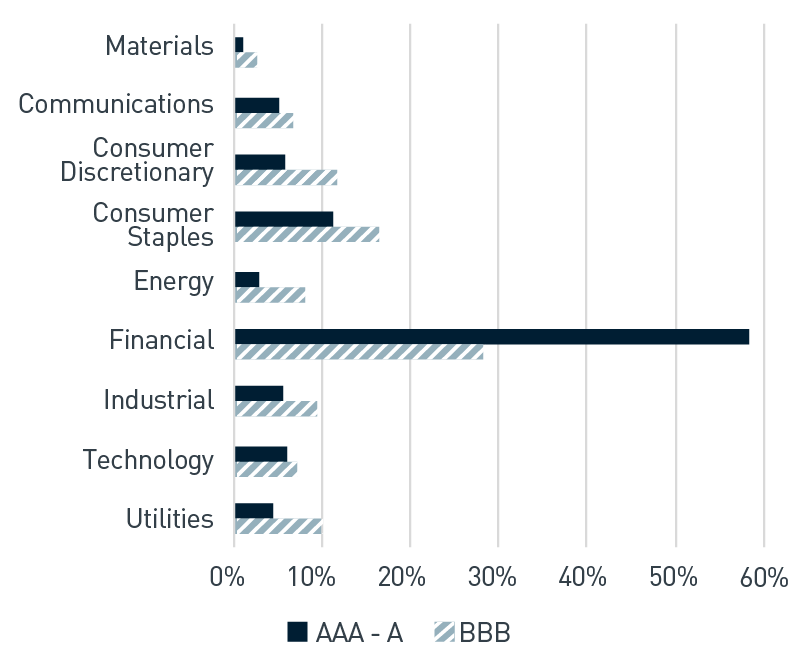
As of 12/31/2025. Source: Bloomberg, L.P. View accessible version of chart.
Furthermore, restricting BBBs can result in a portfolio that is over- and/or under-exposed to sectors influenced by changes in external factors, such as commodity price risk and changes in interest rates.
Investors should also understand that many modern BBB-rated issuers are familiar, established companies with solid fundamentals. The top 10 BBB-rated issuers total 8.0% of the par value of the index and boast an average equity market capitalization of more than $165 billion (Figure 4).
Figure 4. Bloomberg U.S. Corporate Bond Index, Largest BBB Issuers by Index Market Value
| Name |
Rating |
Equity Market Cap ($B) |
Market Value (% of Index) |
| Oracle Corp. |
BBB |
560.0 |
1.13 |
| Verizon Communications Inc. |
BBB+ |
171.7 |
1.07 |
| AT&T Inc. |
BBB |
176.1 |
1.06 |
| T-Mobile US Inc. |
BBB+ |
227.1 |
0.83 |
| General Motors Co |
BBB |
75.9 |
0.71 |
| CVS Health Corp. |
BBB |
100.7 |
0.71 |
| Amgen Inc. |
BBB+ |
176.3 |
0.64 |
| Charter Communications Inc. |
BBB- |
30.5 |
0.64 |
| Barclays PLC |
BBB+ |
88.2 |
0.62 |
| Ford Motor Co |
BBB- |
52.3 |
0.30 |
As of 12/31/2025. Source: Bloomberg, L.P.
To BBB, or Not to BBB?
Hesitancy toward BBBs may be due in part to broader macroeconomic concerns and the potential impact on BBB-rated issuers. In the current environment, the lagged effects of higher interest rates and potential for weaker economic growth— not to mention a company's ability to navigate these conditions — are important factors to consider. However, while macro risks are rising, fundamentals generally remain strong. Many companies took meaningful steps to shore up balance sheets and strengthen liquidity profiles during the pandemic, which has provided a cushion to navigate softer economic conditions and service debt. As it relates to BBBs in particular, leverage relative to single-As has compressed over the last several years (Figure 5). A strategy that limited BBB exposure would have missed out on a long cycle of improving relative credit trends at the expense of potential excess returns.
Figure 5. U.S. Investment Grade Net Leverage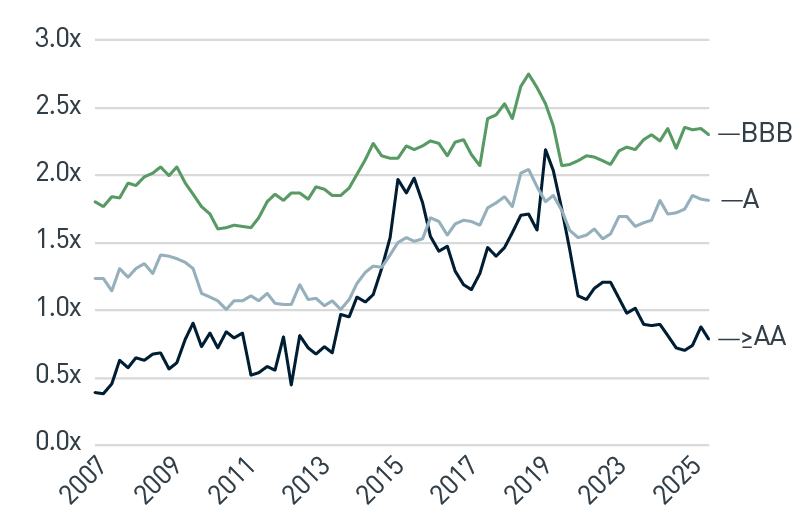
As of 2/28/2026. Source: Bloomberg, L.P. View accessible version of chart.
Another often cited concern around BBBs is the potential for further rating downgrades. It is worth noting, historically, the likelihood of a downgrade from the A-rated to BBB-rated category is higher than the probability of a downgrade from BBB to BB (Figure 6). This likely reflects the broadening diversity of sectors and issuers among the BBB-rated cohort as the segment has grown. In making a relative value determination, our team assesses whether an issuer's prospective ratings trajectory is reflected in the incremental spread of their securities.
Figure 6. Average Five-Year Letter Rating Migration Rates from (1970-2024)
Downgrade to any rating category
| AAA |
AA |
A |
BBB |
BB |
B |
CCC |
| 27.6% |
28.1% |
16.6% |
10.0% |
13.2% |
7.3% |
1.4% |
As of 12/31/2025. Source: Moody's Ratings
BBBs Can Improve Risk-Return Profiles
When building client portfolios, we evaluate sectors, issuers and securities using a consistent F-V-T (Fundamentals, Valuations and Tactics) framework to provide a common lens to evaluate relative risk and potential volatility. At the security level, one key metric we rely on is the modified information ratio (MIR), which allows us to focus on securities that have historically demonstrated attractive return per unit of risk. MIRs are calculated by dividing realized excess returns by the volatility of those excess returns. When we analyze BBBs through the lens of MIRs, we believe BBB-rated securities provide adequate compensation for the added volatility risk by improving a portfolio's expected return (Figure 7). This is especially pronounced in short duration portions of the market.
Figure 7. Bloomberg U.S. Corporate Bond Index, Characteristics (10/2009-7/2025)
BBBs historically provide risk-proportionate returns
Average Excess Return (% per year)
| |
AAA-AA |
A |
BBB |
| 1-3 Year |
1.11 |
1.61 |
1.82 |
| 3-5 Year |
1.64 |
2.32 |
2.58 |
| 5-7 Year |
1.99 |
2.32 |
2.58 |
| 7-10 Year |
1.77 |
2.31 |
3.07 |
| 10+ Year |
1.44 |
2.47 |
2.55 |
Volatility (% per year)
| |
AAA-AA |
A |
BBB |
| 1-3 Year |
0.91 |
1.25 |
2.08 |
| 3-5 Year |
1.72 |
2.29 |
3.51 |
| 5-7 Year |
2.23 |
3.31 |
4.48 |
| 7-10 Year |
3.36 |
4.08 |
5.67 |
| 10+ Year |
5.90 |
6.57 |
8.62 |
Modified Information Ratio
| |
AAA-AA |
A |
BBB |
| 1-3 Year |
0.775 |
0.892 |
0.774 |
| 3-5 Year |
0.564 |
0.713 |
0.660 |
| 5-7 Year |
0.600 |
0.601 |
0.606 |
| 7-10 Year |
0.358 |
0.433 |
0.407 |
| 10+ Year |
0.233 |
0.219 |
0.287 |
As of 12/31/2025. Source: ICE BofA Indices, PNC Capital Advisors
BBB-quality categories have shown the highest average excess returns across all maturity groups since the global financial crisis. In fact, 5- to 7-year BBBs have generated the highest average returns across all maturity and quality segments. BBBs have also reflected significant increases in return volatility relative to higher-quality segments. However, investors have historically been compensated for the higher volatility as the MIRs exhibit remarkable consistency between BBB and A-rated categories across maturities.
Overall MIR relationships across quality and maturity are consistent with the credit matrix published in our Risk Return Outcomes white paper. Excess returns in BBB-rated Corporate Credit offer similar diversification benefits and correlation to broad subsectors of structured products as higher-quality credit segments (Figure 8).
Figure 8. Bloomberg U.S. Corporate Bond Index Correlation to ICE BofA US 15-Year MBS Index (10/31/2009-12/31/2025)
BBBs show lower 30-year MBS correlation
| |
AAA-AA |
A |
BBB |
| MBS 15-Year |
0.45 |
0.46 |
0.44 |
| MBS 30-Year |
0.42 |
0.44 |
0.41 |
| ABS Auto |
0.67 |
0.70 |
0.75 |
| ABS CC |
0.71 |
0.75 |
0.77 |
| 10+ Year |
0.43 |
0.44 |
0.43 |
As of 12/31/2025. Source: ICE BofA Indices, PNC Capital Adviosrs
Let it BBB
Leveraging the breadth of our sector expertise and research capabilities, we seek to identify securities we believe offer adequate additional return opportunities for the inherent risk. Incorporating BBB-rated securities into our portfolio construction process broadens sector and issuer diversification and materially reduce concentration risk in Finance-related issuers. We believe including BBB-rated bonds can result in better risk-adjusted return outcomes for portfolios.
Accessible Charts
Figure 1. Bloomberg U.S. Corporate Bond Index Quality Migration
| Category |
2000 |
2005 |
2010 |
2015 |
2020 |
2025 |
| AAA |
2.8 |
4.6 |
0.6 |
1.0 |
1.7 |
1.0 |
| AA |
16.8 |
6.7 |
16.2 |
8.7 |
7.5 |
7.4 |
| A |
49.2 |
44.3 |
45.9 |
47.2 |
40.5 |
44.0 |
| BBB |
31.1 |
44.4 |
37.2 |
43.1 |
50.2 |
47.6 |
Figure 2. Bloomberg U.S. Corporate Bond Index by Quality and Sector
| Sector |
AAA-AA |
BBB |
| Basic Materials |
1 |
3 |
| Communications |
7 |
12 |
| Consumer Cyclical |
4 |
8 |
| Consumer Non-Cyclical |
18 |
18 |
| Energy |
4 |
11 |
| Financial |
41 |
22 |
| Industrial |
7 |
9 |
| Technology |
7 |
8 |
| Utilities |
10 |
10 |
Figure 3. Bloomberg 1-3 Year U.S. Corporate Bond Index by Quality and Sector
| Sector |
AAA-AA |
BBB |
| Basic Materials |
1 |
3 |
| Communications |
5 |
7 |
| Consumer Cyclical |
6 |
12 |
| Consumer Non-Cyclical |
11 |
17 |
| Energy |
3 |
8 |
| Financial |
58 |
28 |
| Industrial |
6 |
9 |
| Technology |
6 |
7 |
| Utilities |
4 |
10 |
Figure 5. U.S. Investment Grade Net Leverage
| Category |
2010 |
2015 |
2020 |
2025 |
| >=A |
0.91 |
1.10 |
1.71 |
0.71 |
| A |
1.31 |
1.20 |
2.02 |
1.75 |
| BBB |
1.86 |
2.01 |
2.66 |
2.35 |
Important Disclosures
This publication is for informational purposes only. Information contained herein is believed to be accurate, but has not been verified and cannot be guaranteed. Opinions represented are not intended as an offer or solicitation with respect to the purchase or sale of any security and are subject to change without notice. Statements in this material should not be considered investment advice or a forecast or guarantee of future results. To the extent specific securities are referenced herein, they have been selected on an objective basis to illustrate the views expressed in the commentary. Such references do not include all material information about such securities, including risks, and are not intended to be recommendations to take any action with respect to such securities. The securities identified do not represent all of the securities purchased, sold or recommended and it should not be assumed that any listed securities were or will prove to be profitable. Past performance is no guarantee of future results.
PNC Capital Advisors, LLC claims compliance with the Global Investment Performance Standards (GIPS®). A list of composite descriptions for PNC Capital Advisors, LLC and/or a presentation that complies with the GIPS® standards are available upon request.
PNC Capital Advisors, LLC is a wholly-owned subsidiary of PNC Bank N.A. and an indirect subsidiary of The PNC Financial Services Group, Inc. serving institutional clients. PNC Capital Advisors’ strategies and the investment risks and advisory fees associated with each strategy can be found within Part 2A of the firm’s Form ADV, which is available at https://pnccapitaladvisors.com.
Index definitions are available at https://www.pnccapitaladvisors.com/index-definitions//
©2026 The PNC Financial Services Group, Inc. All rights reserved.
FOR INSTITUTIONAL USE ONLY
INVESTMENTS: NOT FDIC INSURED-NO BANK GUARANTEE – MAY LOSE VALUE