Recent inflation statistics demand continued monitoring, but a surge in recent numbers can be partially explained by certain transitory components upon closer examination. We’re not ready to jump to any conclusions, but we will be paying close attention to upcoming Federal Reserve (Fed) communications for any clues about potential changes in monetary policy.
Expectations for higher levels of inflation have been steadily building over the last couple of quarters as the economic recovery continued to progress. Monetary and fiscal policy support proved to be successful in stemming the steep downturn last year, but with policymakers indicating continued accommodation, worries have grown that too much support may push inflation to elevated levels. This concern has been amplified recently as the economy continues to reopen and an increasingly vaccinated populace appears eager to make up for 2020’s sacrificed consumption. Given we are approaching the one-year anniversary of the most severe economic disruptions, it is not surprising to see sharp jumps in inflation readings now that last year’s figures are rolling out of the year-over-year calculations (the “base effects”).
The April consumer price index (CPI) report was expected to illustrate this dynamic and it did not disappoint, as readings for the month printed at levels that hadn’t been seen in many years. The headline figure of 4.2% was the highest year-over-year figure since 2008, while the less volatile core (ex-food and energy) measure rose 3.0%, which was a figure not seen since the mid 1990’s (Figure 1). These statistics were well above consensus expectations, exacerbated by both supply chain issues as well as a more robust reopening impact than expected. However, when taking a deeper look at the components of the April report, the sectors that had the largest influence in the monthly figure were used cars, airfare, hotel lodging and auto rentals, which collectively contributed the bulk of the core measure’s monthly increase (Figure 2). Given the supply and demand imbalances unique to these sectors, it is reasonable to expect this will be a temporary surge that will normalize later this year as supply constraints ease. It is also worth noting prices in many of the reopening and travel-related categories remain below pre-crisis levels, so these increases are reflective of a healthy return to pre-pandemic levels.
Figure 1. CPI vs. Core CPI
Both headline and core CPI figures have moved to postfinancial crisis highs.
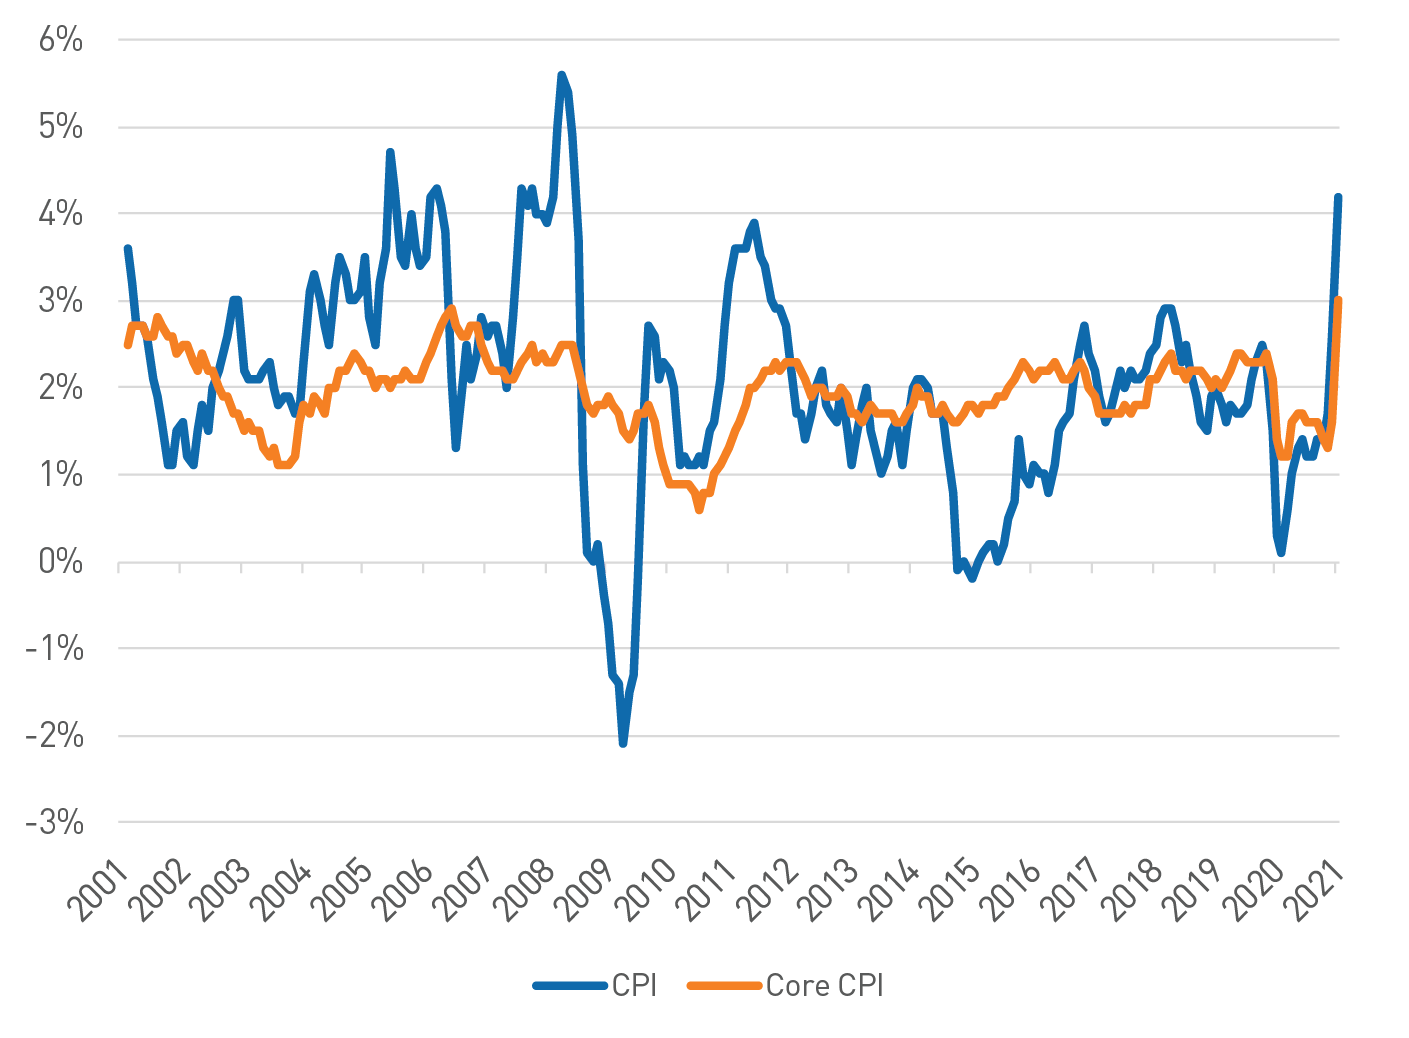
As of 04/30/21. Source: Bloomberg L.P
We believe this is all consistent with the transitory narrative the Fed has been forecasting related to inflation; however, it does warrant attention given the degree of the upside surprise, as well as the anecdotal stories of input shortages and persistent bottlenecks intensifying supply chain concerns (Figure 3). How forward-looking inflation expectations evolve in the coming months will be of utmost concern to the Fed given the high levels of uncertainty related to the unique drivers of the current situation. While having expressed comfort with an inflation “overshoot” given lower-than-desired inflation following the financial crisis, the Fed will need to be mindful of its credibility should inflation expectations become untethered (Figure 4).
Figure 2. Manheim Used Vehicle Value Index, year over year
Used vehicle prices have soared as the availability of new cars has declined due to a semiconductor shortage.
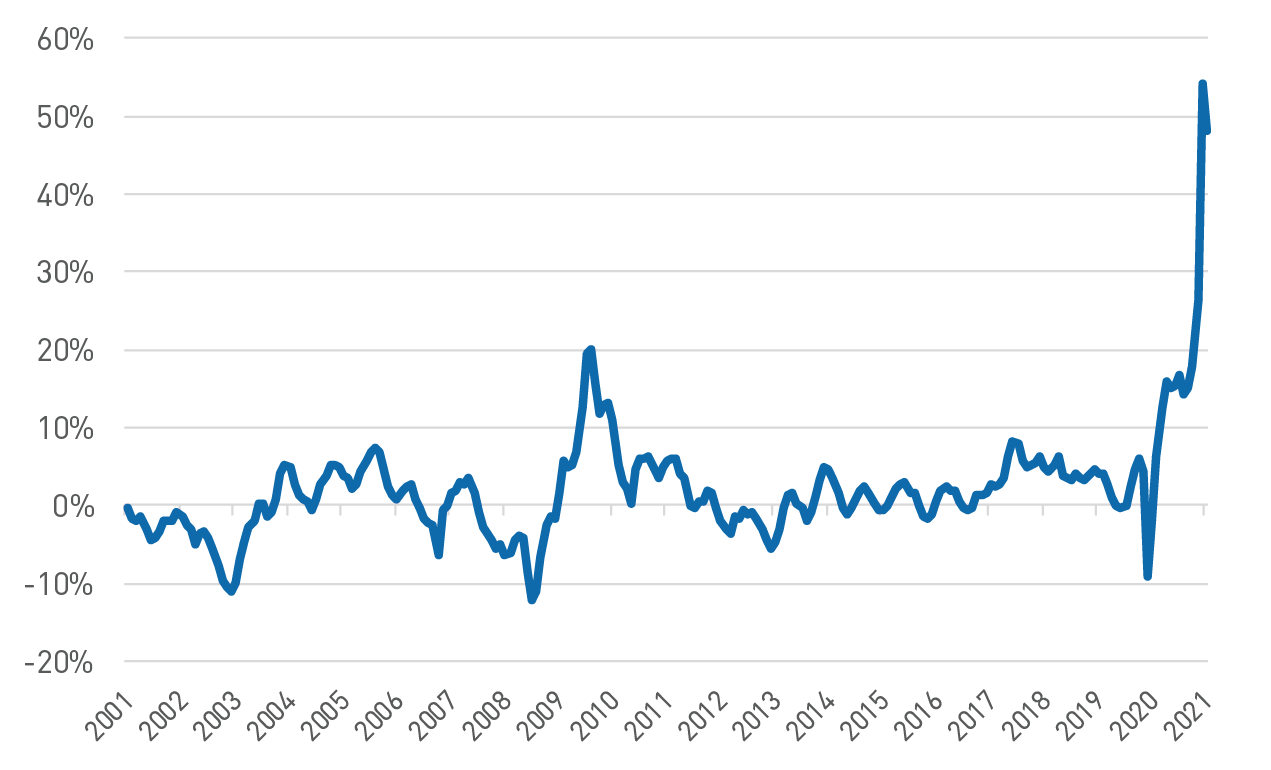
As of 04/30/21. Source: Bloomberg
Figure 3. Commodity Research Bureau BLS/US Spot Raw Industrials Price Index
Commodity input prices have experienced a sharp rise recently as well.
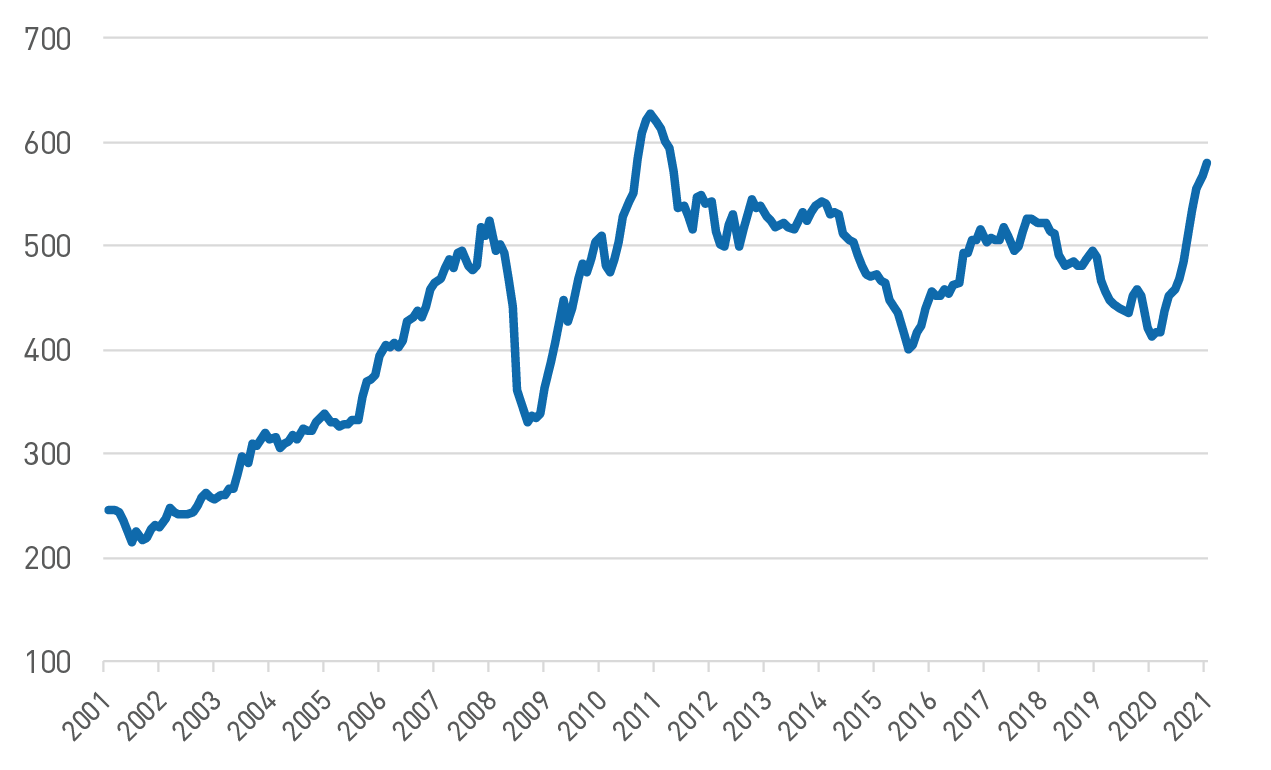
As of 04/30/21. Source: Bloomberg
So far this hasn’t been an issue in Treasury markets, as rates reacted by moving modestly higher immediately following the CPI release and then generally drifting lower over the following days. Similarly, breakeven rates on Treasury Inflation Protected Securities (TIPS) have retreated in recent days after steadily moving higher over most of the last year, suggesting much of the inflationary expectations were already factored into market pricing (Figure 5). Of note, the real rate on 10-year TIPS has fallen to around -0.80% after rising above -0.60% late in the first quarter, which suggests financing conditions remain highly accommodative.
Inflation measures will almost certainly remain elevated and be quite volatile in the coming months but given the unique circumstances of the current economic environment, it is important to be mindful of the underlying components of inflation for a truer picture of the overall story. When taken together with other economic data, namely the disappointing April payroll report, the Fed may have some time to remain patient. However, the Fed appears aware of the fluid nature of the current environment, as evident by this notable mention from the minutes of the April Federal Open Market Committee (FOMC) meeting: “A number of participants suggested that if the economy continued to make rapid progress towards the Committee’s goals, it might be appropriate at some point in coming meetings to begin discussing a plan for adjusting the pace of asset purchases.” Perhaps it is finally time to start talking about an adjustment to monetary policy. We will continue to look for clues in Fed communications, including upcoming FOMC meeting minutes (June and July) and the Jackson Hole symposium that has recently been a forum for communicating these types of changes.
Figure 4. University of Michigan: Inflation Expectations
The University of Michigan expected inflation rate over the next 5-10 years is well
above the Fed’s long-term estimate.
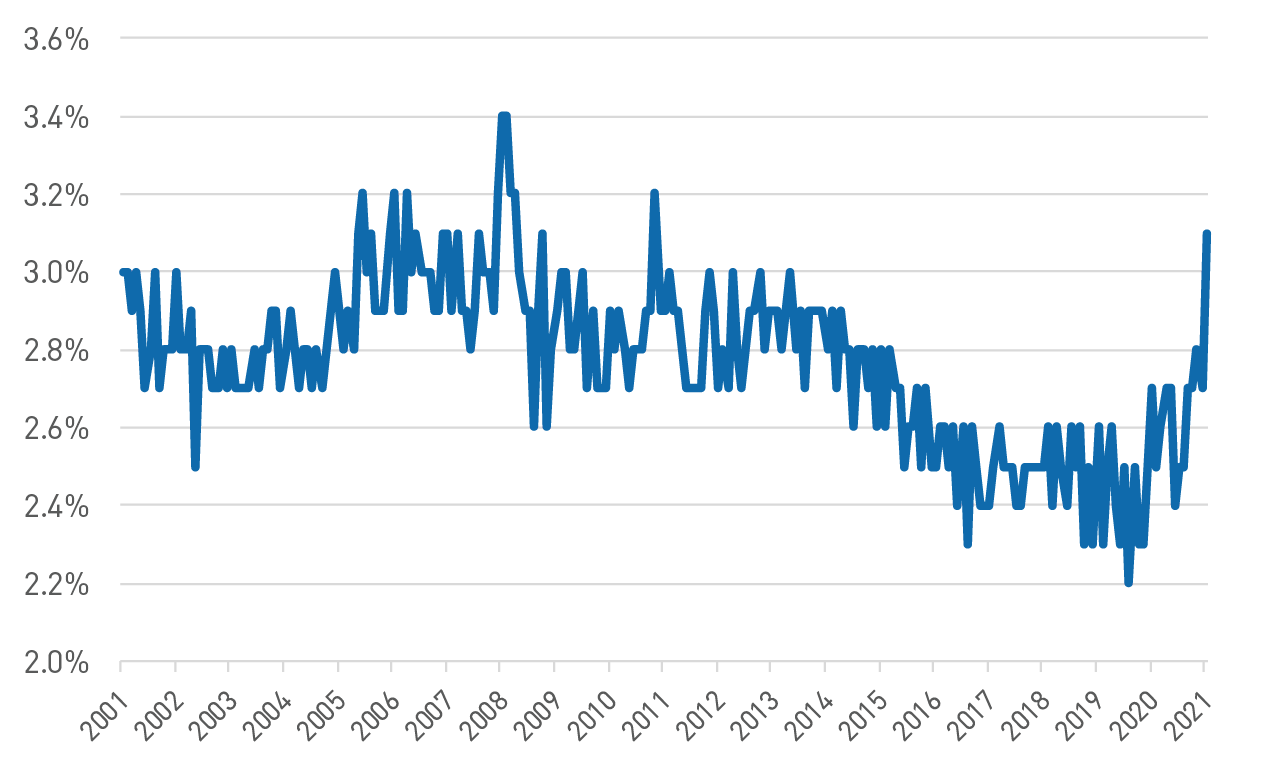
As of 05/21/21. Source: Bloomberg L.P
Figure 5. TIPS Breakeven Rates
The breakeven rate between nominal U.S. Treasuries and
TIPS has continued to rise since bottoming early last year.
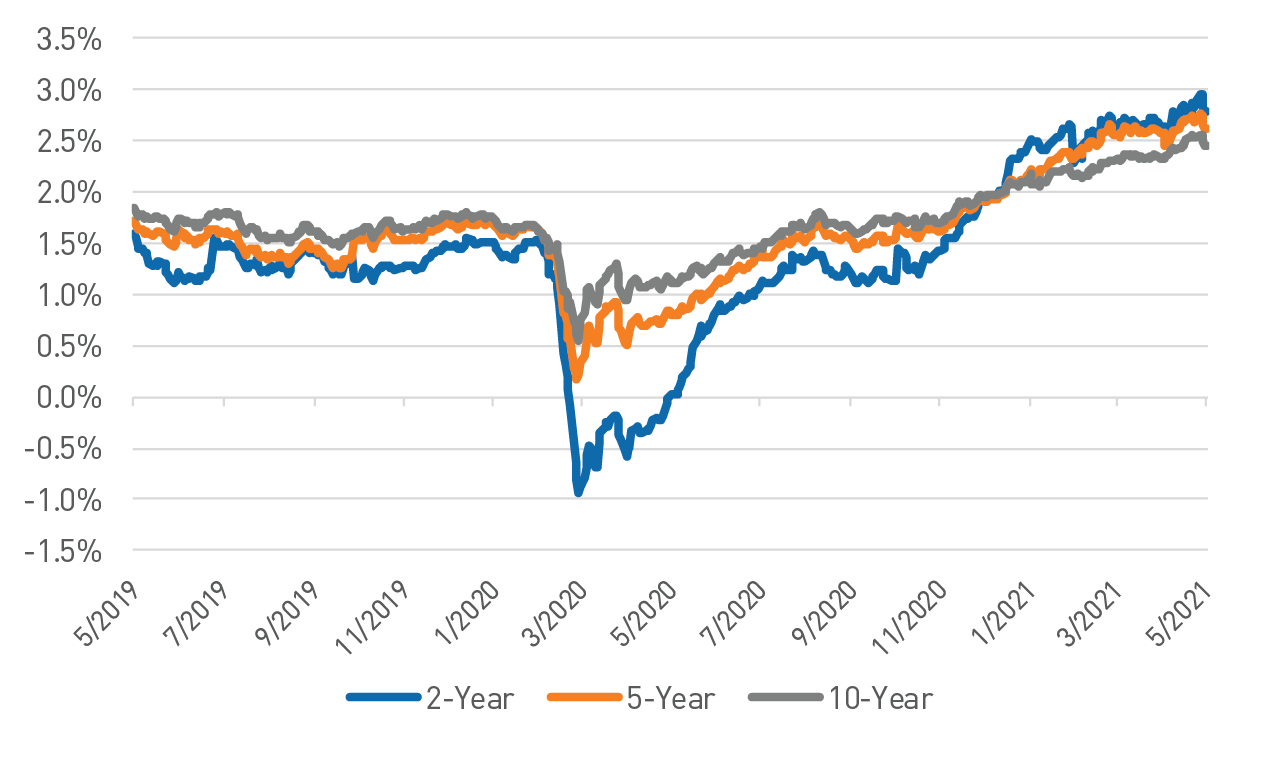
As of 05/21/21. Source: Bloomberg L.P
Presentation of Performance of Market Indices
Various market indices may be referred to in these materials. Please see following for a brief description of these indices and comparisons. Indices are unmanaged and not available for direct investment. The performance of an index does not reflect expenses associated with the active management of an actual portfolio.
- The Consumer Price Index (CPI) is a measure of the average change over time in the prices paid by urban consumers for a market basket of consumer goods and services.
- The Core Consumer Price Index (Core CPI) is a measure of the average change over time in the prices paid by urban consumers for a market basket of consumer goods and services, excluding food and energy.
- The Manheim Used Vehicle Value Index is recognized by financial and economic analysts as the premier indicator of pricing trends in the used vehicle market.
- The Commodity Research Bureau BLS/US Spot Raw Industrials Price Index is a measure of price movements of 22 sensitive basic commodities whose markets are presumed to be among the first to be influenced by changes in economic conditions. As such, it serves as one early indication of impending changes in business activity.
Important Disclosures
BLOOMBERG® is a trademark and service mark of Bloomberg Finance L.P. and its affiliates (collectively “Bloomberg”). BARCLAYS® is a trademark and service mark of Barclays Bank Plc (collectively with its affiliates, “Barclays”), used under license. Bloomberg or Bloomberg’s licensors, including Barclays, own all proprietary rights in the Bloomberg Barclays Indices. Neither Bloomberg nor Barclays approves or endorses this material, or guarantees the accuracy or completeness of any information herein, or makes any warranty, express or implied, as to the results to be obtained therefrom and, to the maximum extent allowed by law, neither shall have any liability or responsibility for injury or damages arising in connection there with.
This publication is for informational purposes only. Information contained herein is believed to be accurate, but has not been verified and cannot be guaranteed. Opinions represented are not intended as an offer or solicitation with respect to the purchase or sale of any security and are subject to change without notice. Statements in this material should not be considered investment advice or a forecast or guarantee of future results. To the extent specific securities are referenced herein, they have been selected on an objective basis to illustrate the views expressed in the commentary. Such references do not include all material information about such securities, including risks, and are not intended to be recommendations to take any action with respect to such securities. The securities identified do not represent all of the securities purchased, sold or recommended and it should not be assumed that any listed securities were or will prove to be profitable. Past performance is no guarantee of future results.
PNC Capital Advisors, LLC claims compliance with the Global Investment Performance Standards (GIPS®). A list of composite descriptions for PNC Capital Advisors, LLC and/or a presentation that complies with the GIPS® standards are available upon request.
PNC Capital Advisors, LLC is a wholly-owned subsidiary of PNC Bank N.A. and an indirect subsidiary of The PNC Financial Services Group, Inc. serving institutional clients. PNC Capital Advisors’ strategies and the investment risks and advisory fees associated with each strategy can be found within Part 2A of the firm’s Form ADV, which is available at https://pnccapitaladvisors.com.
©2021 The PNC Financial Services Group, Inc. All rights reserved.
FOR INSTITUTIONAL USE ONLY
INVESTMENTS: NOT FDIC INSURED-NO BANK GUARANTEE – MAY LOSE VALUE