The corporate credit market often provides a wide range of attractive risk-return opportunities across qualities and maturities. Given continuously changing market dynamics, having a disciplined, repeatable security selection process is paramount, particularly as we seek to deliver consistent portfolio outcomes across market cycles.
Our security selection process is built on our F-V-T (fundamentals, valuation and tactics) framework. For the credit sector, our FVT process combines our fundamental overview of a credit, the relative value of an issuer’s debt securities and a consideration of market conditions. Our risk-return framework has illustrated that credit exhibits higher average excess returns but also higher return volatility relative to structured product sectors (see our whitepaper, “Optimizing Risk-Return Outcomes in Core Fixed Income”).
As we build portfolios, we rely on two key measures to quantify risk: contribution to duration (CTD) and duration times spread (DTS). By using CTD and DTS, we can compare securities across sectors and industries using the common denominator of units of duration, a fundamental risk measure. We believe our risk‑focused process is a defining characteristic of our portfolio management approach and helps us balance clients’ risk and return objectives.
Understanding Benchmark
Composition: It’s All Relative
Our portfolio construction process begins with a thorough understanding of the benchmark characteristics and risk attributes for our clients’ mandates. Benchmarks represent a broad cross-section of our investable universe and help define the baseline risk-return characteristics our clients expect us to deliver. Likewise, portfolio structure and security selection decisions that deviate from the benchmark are what define our view of the optimal risk-return profile for each client. The portfolio’s active risk or tracking error measures these deviations.
Both Bloomberg and ICE BofA indices include corporate and non-corporate credit securities. While index composition varies slightly between the two, securities share some common elements:
- they must have a fixed coupon (no floating rate) and be U.S. dollar denominated;
-
they must be investment-grade rated (Baa3/BBB- or higher);
- and,
must have a minimum amount of each issue outstanding.
Corporate bond issuance has increased significantly since the Global Financial Crisis, exceeding $1 trillion on a gross basis in each of the last 10 years. Figures 1 and 2 illustrate the evolution of the Bloomberg Bond U.S. Aggregate Bond Index (the Agg) since 2011. Corporate credit peaked in the quarters following the onset of the COVID pandemic as issuers looked to term-out short-term debt and take advantage of low all-in yields in a zero policy rate environment.
Figure 1. Bloomberg U.S. Aggregate Bond Index, Composition by Sector (% of Market Value)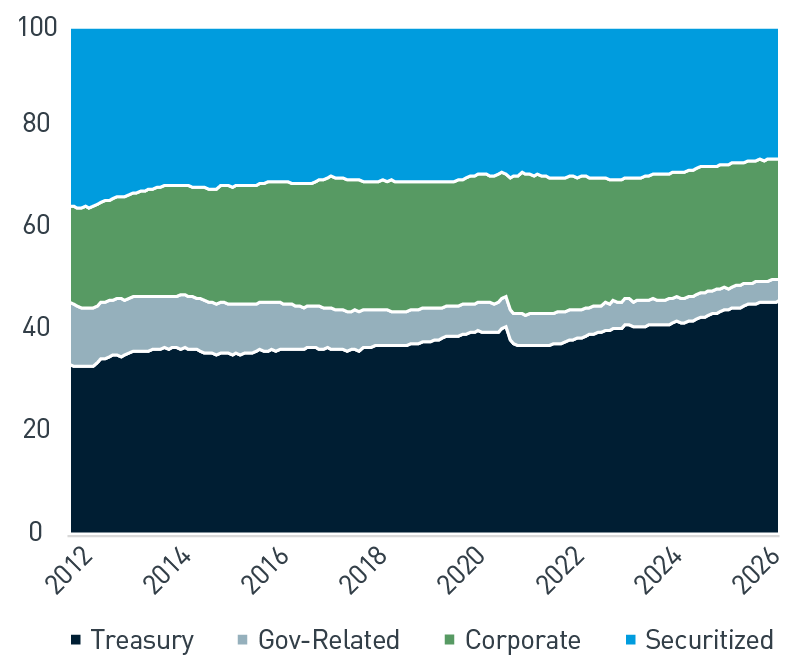
As of 2/28/2026. Source: Bloomberg, L.P. View accessible version of chart.
Figure 2. Bloomberg U.S. Aggregate Bond Index, Composition by Quality (% of Market Value)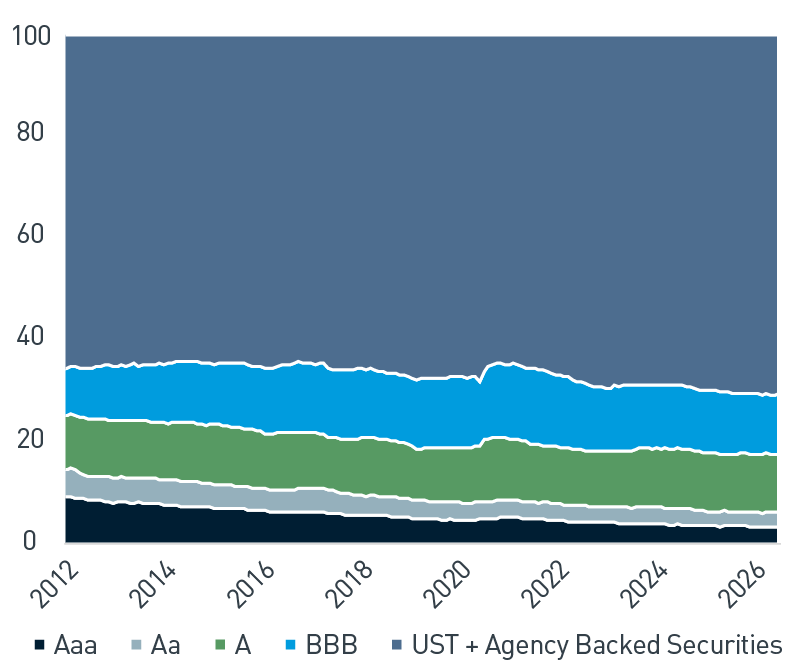
As of 2/28/2026. Source: Bloomberg, L.P. View accessible version of chart.
During the same time, persistent fiscal deficits have pushed up the U.S. Treasury contribution to the Agg at the expense of spread sectors broadly. In addition, as issuers have become more comfortable with increased leverage, BBB-rated issuance has increased. As shown in Figure 3, the rolling 10-year average of BBB-rated issuance peaked in 2021 at 40.6%, and remains near 40% today. In fact, we would note the increased contribution from BBB-rated issuers in sectors such as Energy, Finance, Healthcare and Telecommunications. Our whitepaper, “Portfolio Construction Report Card — Don’t Insist on Straight A’s,” discusses the dynamics of the BBB-sector in greater detail.
Figure 3. Bloomberg U.S. Aggregate Bond Index, New Issuance by Quality (% of Market Value)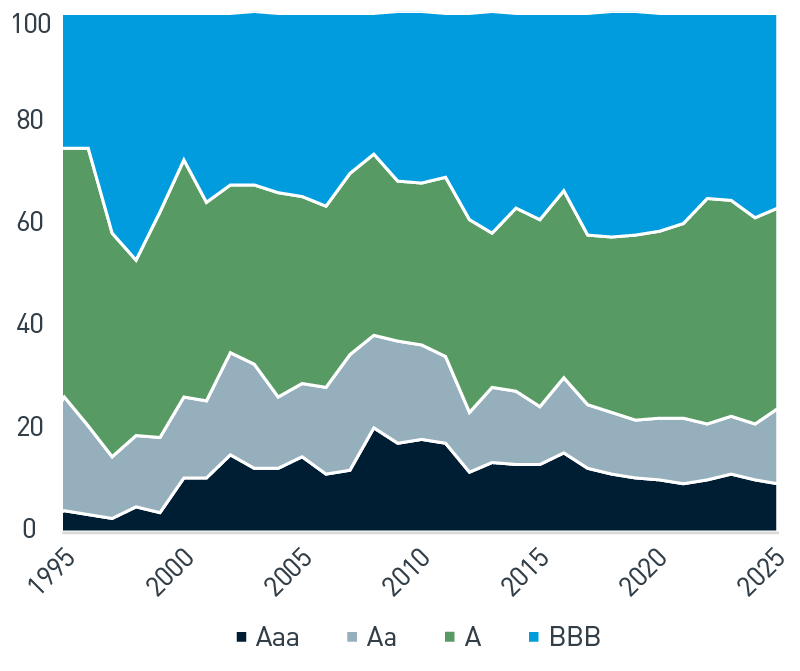
As of 12/31/2025. Source: Bloomberg, L.P. View accessible version of chart.
Also, after the Global Financial Crisis, rating agencies changed their methodologies for financial institutions, which led to lower credit ratings for most banks, both domestic and global. Increased capital buffers, stronger liquidity and improved earnings quality in the last several years have supported the migration of domestic Global Systematically Important Financial Institutions from the BBB-category to the single-A category. Most recently, we would note the increase in AA-rated issuance to 14.6% as of December 2025, reversing a steady decline in the high quality sector that started in 2011. This is in part related to artificial intelligence infrastructure financing, a trend we expect to continue in 2026 and beyond.
We view the evolving credit quality profile of benchmark credit securities as an opportunity to emphasize the rigor of our research process. While bond ratings set a baseline evaluation of an issuer’s creditworthiness and comparative risks, we use the FVT framework to evaluate each issuer’s characteristics independently. We have found that issuer ratings provide a useful means to stratify risk in the corporate bond sector. However, we believe the combination of this stratified credit assessment with our team-based, independent credit research creates a more effective process for managing credit risk.
Credit Selection: Fundamentals, Valuation and Tactics
Our team-based approach is the cornerstone of our credit selection process. It begins with an in depth review by the lead analyst dedicated to a particular industry, then ideas are further vetted by the broader credit team prior to initiating a position. This allows us to draw on the collective experience of each credit team member and reflect the broader team’s macro and economic themes in sub-sector allocations across industry and quality.
Fundamentals
Our fundamental analysis is intended to help us evaluate whether we are comfortable with the issuer and the industry in which they operate. Our research focuses on several areas:
- the company’s operating model and its position in the industry (What is the competitive landscape?);
- the overall strength of the industry (What are the margin, growth and cyclical characteristics?);
- earnings, cash flow and leverage (Are the cash flows stable and are they sufficient for debt service and capital investment?);
- the management team’s reputation (How are the needs of equity and debt holders served?);
- and,
the company’s capital structure (Are there sufficient assets at each level of the capital structure to honor claims?).
Valuation
While we could like the overall fundamentals of a business, the pricing of an issuer’s securities might not be attractive. Valuation analysis compares the risk premia of an issuer’s securities relative to others in its industry, as well as those outside its industry. We also consider issue amount outstanding, bond premium (or discount) to par, trading volume in the issue (liquidity) and where the security is positioned in the capital structure.
Tactics
Tactics focus on market conditions and how we implement our strategies. Through this step, we focus on best execution for our clients, and that relies heavily on the insights and experience of our corporate bond traders. We consider technical factors such as new-issue supply, market sentiment and liquidity. We prefer to be buyers when the market is better offered and sellers when the market is richly valued.
The FVT process highlights the steps we undertake to evaluate and invest, at the security level, in a corporate bond issuer. However, this process does not illustrate how we determine the amount to invest in an issuer or how we assess the riskiness of a position. We believe a disciplined portfolio construction process, and one that is predicated on assessing and managing credit risk, supports the goals of capital preservation while delivering suitable risk-adjusted returns. The rest of this paper will lay out the framework for how we allocate and manage risk in the credit market.
How We Define Risk: Contribution to Duration, Explained
When building portfolios, we seek to balance our clients’ investment objectives and return expectations with their risk tolerance. To help accomplish this, we calculate each holding’s contribution to the duration of the total portfolio. Each bond’s CTD is calculated by multiplying its market-value weight by its duration; the sum of these individual weights equals the duration of the total portfolio.
This can be illustrated with a simple hypothetical two-bond portfolio:
| |
Market Value Weight |
Duration |
CTD |
| Bond A |
50% |
4 |
2 |
| Bond B |
50% |
12 |
6 |
| Total |
100% |
|
8 |
For illustration only.
While Bond A and Bond B have the same market value weights, the longer duration of Bond B contributes significantly more CTD to the portfolio duration. These relationships are critical to portfolio management because bonds with longer maturities (and hence duration) have different risk characteristics than shorter-duration bonds.
It is important to note, from a credit risk perspective, CTD matters more to us than the market value weight of issuers in the index. As the option-adjusted spreads (OASs) of higher CTD issuers change, they will have more relative impact on our portfolios than those with less CTD. The largest contributors to the duration of a portfolio or an index can often be quite different from the largest market value weights.
We can observe this dynamic by looking at the composition of the Agg. In Figure 4, we would note four of the top 10 issuers by market value are different than the top 10 issuers by contribution to duration. Of note, using the lens of CTD reduces the concentration in Financials and includes sectors like Telcommunications, Technology and Healthcare.
Figure 4. Top Ten Issuers, Bloomberg Aggregate
| By Percent Market Value |
% |
| JP Morgan |
0.56 |
| Bank of America |
0.51 |
| Morgan Stanley |
0.49 |
| World Bank |
0.38 |
| Citigroup Inc |
0.38 |
| Wells Fargo |
0.37 |
| Goldman Sachs |
0.37 |
| European Inv Bank |
0.30 |
| HSBC |
0.29 |
| Mexico Govt |
0.27 |
| By Contribution to Duration |
% |
| JP Morgan |
0.031 |
| Bank of America |
0.029 |
| AT&T Inc |
0.025 |
| Morgan Stanley |
0.024 |
| Verizon |
0.023 |
| Oracle |
0.023 |
| Mexico Govt |
0.022 |
| Wells Fargo |
0.022 |
| Goldman Sachs |
0.021 |
| UnitedHealth |
0.021 |
As of 12/31/2025. Source: Bloomberg, L.P., ICE BofA Indices
On Managing Individual Issuer Concentrations
Our issuer selection and portfolio construction processes bring these concepts full circle as we consider the portfolio’s appropriate risk exposure on a security-by-security basis. Target exposures are based on each issuer’s CTD in the relevant benchmark plus a percentage of the overall portfolio’s duration. We also calculate each issue’s credit risk limit using a reference matrix that considers an issuer’s credit rating and duration. Lower-rated, longer-duration securities have lower limits; higher-rated, shorter-duration securities have higher limits. Credit risk is inherently asymmetric and exposes portfolios to idiosyncratic risks that can be difficult to predict. For this reason, we use a market-value limit overlay regardless of duration that is most restrictive for issuers rated Baa3.
How We Refine the Analysis: Duration Times Spread, Explained
In general, all non-U.S. Treasury sectors offer incremental yield or spread, which introduces the opportunity for excess return in exchange for increased volatility. DTS is calculated by multiplying a bond’s duration by its OAS. This measure helps describe a bond’s potential risk or volatility. When analyzing the credit risk of a portfolio, DTS complements CTD and refines the analysis at both the issuer and sector level. Historically, DTS has been a good proxy for excess return volatility, particularly for relative exposures.1
Continuing with the prior example, the portfolio owns more credit CTD than the benchmark. However, the allocation is composed of issuers with lower volatility (spread) and, therefore, credit risk overall is similar to the benchmark in DTS terms. We incorporate DTS analysis at both the issuer and sector level to inform our view on expected volatility in our credit allocations.
| |
CTD |
OAS |
DTS |
| Credit - Portfolio |
0.25 |
20 |
12.5 |
| Credit - Benchmark |
0.15 |
83 |
12.5 |
| |
|
DTS Ratio |
1.0 |
For illustration only.
Measure Twice, Cut Once
The credit market has evolved considerably, growing in both size and contribution to the benchmarks, while at the same time shifting in quality. Therefore, evaluating opportunities and managing risks requires a rigorous process. Our risk management methods use the concepts outlined in this paper as a framework for monitoring and assessing the investment risk of credit exposure. This provides insights as we calculate and attribute returns at both the sector and security level.
It is important to emphasize these concepts are only part of our consideration during the portfolio construction process. Our market outlook, which incorporates a thorough understanding of monetary and fiscal policy, inflation expectations and volatility, drives our sector allocations as well as subsector decisions within credit broadly, along both industry and quality classifications. his provides a foundation for our consistent, repeatable investment process that supports clients’ risk-adjusted objectives over time.
Accessible Charts
Figure 1. Bloomberg U.S. Aggregate Bond Index, Composition by Sector (% of Market Value)
| Category |
2012 |
2014 |
2016 |
2018 |
2020 |
2022 |
2024 |
2026 |
| Treasury |
35.2 |
35.6 |
36.7 |
36.9 |
39.8 |
39.4 |
41.8 |
45.9 |
| Gov-Related |
11.0 |
10.0 |
8.2 |
6.9 |
5.9 |
5.5 |
4.9 |
4.3 |
| Corporate |
20.1 |
22.4 |
24.1 |
22.6 |
25.1 |
25.2 |
24.9 |
23.9 |
| Securitized |
33.7 |
31.9 |
30.9 |
30.5 |
29.2 |
29.9 |
28.4 |
25.9 |
Figure 2. Bloomberg U.S. Aggregate Bond Index, Composition by Quality (% of Market Value)
| Category |
2012 |
2014 |
2016 |
2018 |
2020 |
2022 |
2024 |
2026 |
| AAA |
9.0 |
7.6 |
6.3 |
5.5 |
4.6 |
4.3 |
3.6 |
3.2 |
| AA |
5.5 |
4.9 |
4.3 |
3.8 |
3.4 |
3.2 |
3.1 |
3.1 |
| A |
10.7 |
11.1 |
10.8 |
11.4 |
10.9 |
11.0 |
11.8 |
11.4 |
| BBB |
9.2 |
11.7 |
13.0 |
13.5 |
13.9 |
13.6 |
12.5 |
11.7 |
| UST + Agency Backed Securities |
65.6 |
64.7 |
65.7 |
65.7 |
67.3 |
67.9 |
68.9 |
70.7 |
Figure 3. Bloomberg U.S. Aggregate Bond Index, New Issuance by Quality (% of Market Value)
| Category |
1995 |
2000 |
2005 |
2010 |
2020 |
2025 |
| AAA |
3.9 |
10.3 |
14.3 |
17.8 |
10.0 |
9.2 |
| AA |
14.4 |
15.7 |
14.3 |
18.0 |
11.7 |
14.6 |
| A |
43.3 |
45.8 |
36.0 |
31.3 |
36.1 |
38.4 |
| BBB |
38.4 |
28.2 |
35.4 |
32.9 |
42.2 |
37.8 |
Important Disclosures
1- Arik Ben Dor, Lev Dynkin, Jay Hyman, Patrick Houweling, Erik van Leeuwen and Olaf Penninga; “DTS;” The Journal of Portfolio Management Winter 2007; 33 (2) 77-100; DOI: https://doi.org/10.3905/jpm.2007.67479
This publication is for informational purposes only. Information contained herein is believed to be accurate, but has not been verified and cannot be guaranteed. Opinions represented are not intended as an offer or solicitation with respect to the purchase or sale of any security and are subject to change without notice. Statements in this material should not be considered investment advice or a forecast or guarantee of future results. To the extent specific securities are referenced herein, they have been selected on an objective basis to illustrate the views expressed in the commentary. Such references do not include all material information about such securities, including risks, and are not intended to be recommendations to take any action with respect to such securities. The securities identified do not represent all of the securities purchased, sold or recommended and it should not be assumed that any listed securities were or will prove to be profitable. Past performance is no guarantee of future results.
PNC Capital Advisors, LLC claims compliance with the Global Investment Performance Standards (GIPS®). A list of composite descriptions for PNC Capital Advisors, LLC and/or a presentation that complies with the GIPS® standards are available upon request.
PNC Capital Advisors, LLC is a wholly-owned subsidiary of PNC Bank N.A. and an indirect subsidiary of The PNC Financial Services Group, Inc. serving institutional clients. PNC Capital Advisors’ strategies and the investment risks and advisory fees associated with each strategy can be found within Part 2A of the firm’s Form ADV, which is available at https://pnccapitaladvisors.com.
Index definitions are available at https://www.pnccapitaladvisors.com/index-definitions//
©2026 The PNC Financial Services Group, Inc. All rights reserved.
FOR INSTITUTIONAL USE ONLY
INVESTMENTS: NOT FDIC INSURED-NO BANK GUARANTEE – MAY LOSE VALUE