Given Fed-induced yield increases in 2022, investments at the shortest end of the curve look more attractive than they have in years, but we believe cash’s quick fix could cost liquidity investors more over the long run.
Over much of the last 12 months, investors have been rightfully concerned about the path of Federal Reserve (Fed) policy and the impact on capital market valuations. The Fed’s aggressive rate hike path, aimed at curbing sky-high inflation, roiled equity and fixed income markets during 2022 as the fed funds rate increased from 0.00% - 0.25% to 4.25% - 4.50% over the course of the year. The drawdown across fixed income has been historic, with the Bloomberg U.S. Aggregate Bond Index (Agg) declining more than 14% from its peak in August 2021; the Agg’s yield more than tripled over this timeframe from a nadir of 1.33%.
As the market rapidly repriced for this new interest rate regime, a silver lining emerged from this year’s sharply negative total return. The symmetry of expected return — that is, the balance between downside risk from further rate increases versus the compensation for that risk in the form of return — has improved dramatically. As of December 31, 2022, the Agg carried a yield of 4.68% — more than two-and-a-half times the level at the beginning of 2022. Starting yield provides a baseline for understanding forward return expectations. As shown in Figure 1, a starting yield between 4% - 6% historically has produced an average annual return of 5.65% over the following five-year period.
Figure 1. Agg 5-Year Average Annual Returns by Starting Yield Range (Jan. 1976 - Dec. 2022)
Yield profile has improved symmetry of returns
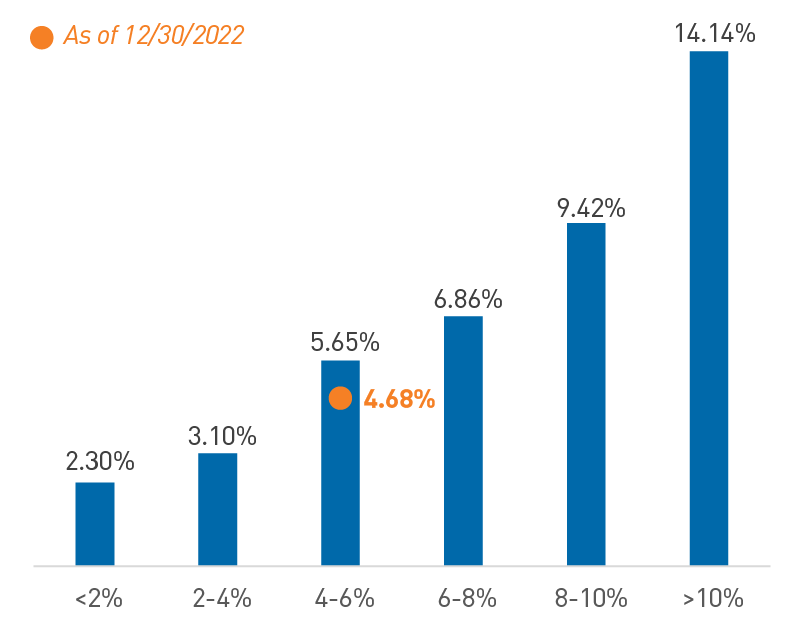
As of 12/30/2022. Source: Bloomberg, L.P., PNC
With the yield curve inverted, reflecting both weaker economic growth and the attendant policy response from the Fed, return symmetry is most attractive in the short/intermediate duration area of the market. Figure 2 depicts a hypothetical return distribution of the 1-year U.S. Treasury (UST) bill and several short/intermediate duration components of the Agg over a three-month investment horizon, assuming a +/-50 basis point (bp) change in interest rates. With yields across these short/intermediate benchmarks around 4.5% or higher, we believe the return symmetry is favorable and provides an opportunity to extend maturity profiles for strategic liquidity portfolios.
Moving out the curve to the short/intermediate space also expands the investable universe, increasing opportunities for diversification. Compared to money markets, the short/intermediate portion of the curve opens an expanded pool of eligible investments, particularly in structured products, such as mortgage- and asset-backed securities. The Structured sector, in our view, is generally high-quality and offers favorable risk and return characteristics from a portfolio construction perspective. It is also worth noting the short/intermediate portions of the curve offer enhanced spread relative to liquidity-oriented investments (Figure 3).
Figure 2. Comparison of Potential Returns
Short/Intermediate indices have more favorable ratios of upside to downside
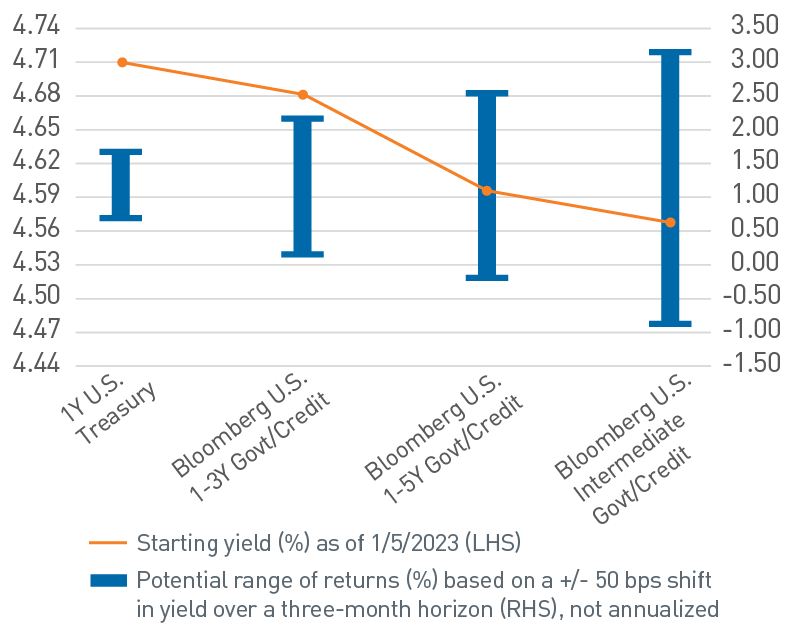
As of 1/5/2023. Source: Bloomberg, L.P., PNC Capital Advisors
Figure 3. Sector Credit Spread Comparison
Short/Intermediate portions of the curve offer enhanced spread
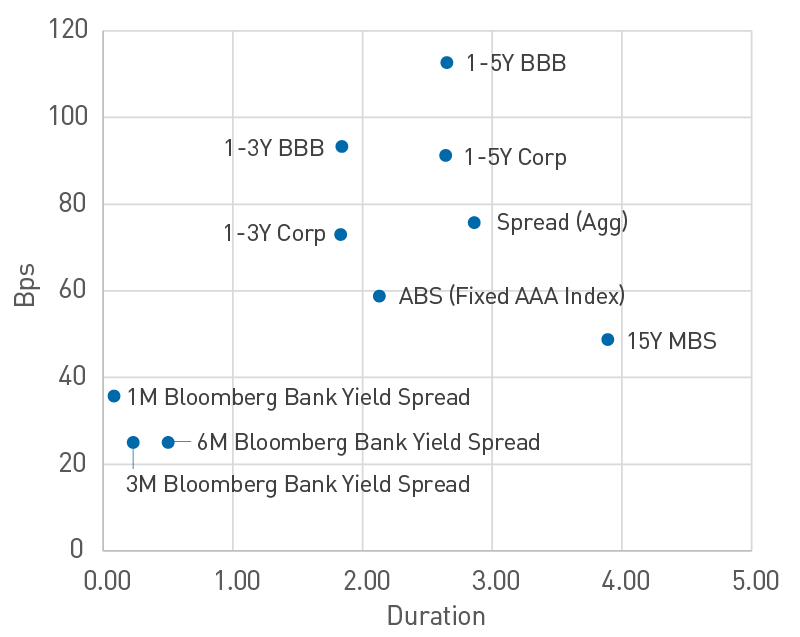
As of 12/30/2022. Source: Bloomberg, L.P.
Risk-return considerations aside, it is important for liquidity investors to understand the context of the market landscape, particularly during an interest rate regime change. Investors should consider how market expectations align with guidance from the Fed — not only its explicit forward guidance, but also the verbal cues from speeches and press conferences following each Federal Open Market Committee (FOMC) meeting. Currently, the fed funds futures market is implying a terminal rate of just under 5%, which is slightly below the mid-December median Fed projection of 5.1% at the end of 2023 (Figure 4).
Figure 4. U.S. Market-Implied Terminal Fed Funds Rate (%)
Markets and the Fed are coalescing around a similar terminal rate
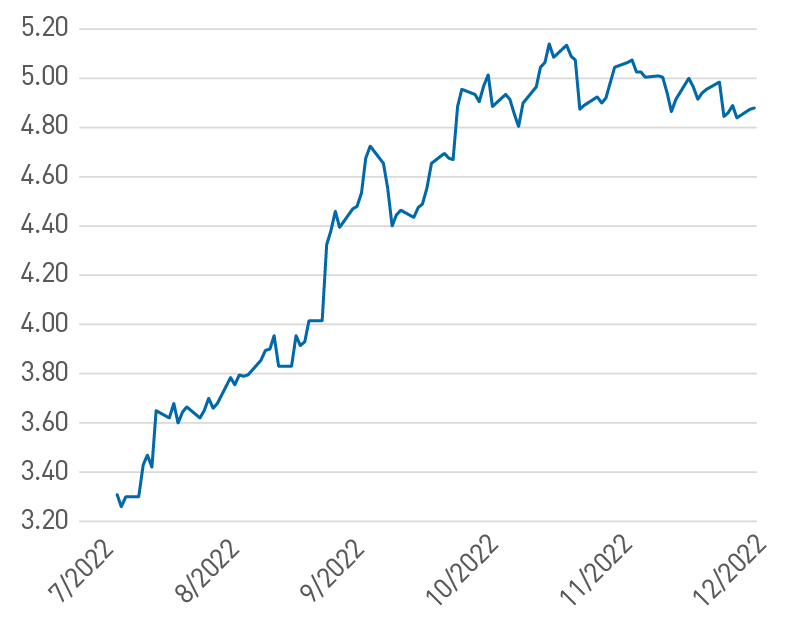
As of 12/20/2022. Source: The Daily Shot®
While the Fed and markets appear to be coalescing around a similar terminal rate, there is a disconnect between the Fed and market expectations about how long higher rates will last. The Fed’s stance is that rates will remain higher for longer to ensure inflation and inflation expectations make material progress toward its 2% long-term objective. The FOMC currently forecasts core Personal Consumption Expenditures inflation will be 3.5% at the end of 2023 and remain above 2% through 2025. In December, the University of Michigan Survey of Consumers median expectation for inflation over the next year was 4.6%. However, futures markets currently expect Fed policy to loosen in late 2023, likely in response to anticipated weaker economic growth. Over the coming months, diverging expectations about the path of future policy could result in elevated volatility and impact not only the level of yields in general, but also the pricing of risk assets.
New Year’s Resolution: Broaden Your (Investment) Horizon
As always, we remain focused on preserving capital in more challenging market environments. As we consider investment opportunities in 2023, we believe liquidity investors are being offered a compelling value proposition to consider extending their portfolio maturity profile. By doing so, we believe investors can potentially earn higher returns and broaden sector diversification with improved risk symmetry as market rates have risen significantly.
Important Disclosures
Bloomberg U.S. Aggregate Bond Index measures the performance of investment grade, U.S. dollar-denominated, fixed rate taxable bond market, including Treasuries, government-related and corporate securities, MBS (agency fixed-rate and hybrid ARM pass-throughs), ABS, and CMBS. It rolls up into other flagship indices, such as the multi-currency Global Aggregate Index and the U.S. Universal Index, which includes high yield and emerging markets debt.
BLOOMBERG® is a trademark and service mark of Bloomberg Finance L.P. and its affiliates (collectively “Bloomberg”). BARCLAYS® is a trademark and service mark of Barclays Bank Plc (collectively with its affiliates, “Barclays”), used under license. Bloomberg or Bloomberg’s licensors, including Barclays, own all proprietary rights in the Bloomberg Barclays Indices. Neither Bloomberg nor Barclays approves or endorses this material, or guarantees the accuracy or completeness of any information herein, or makes any warranty, express or implied, as to the results to be obtained therefrom and, to the maximum extent allowed by law, neither shall have any liability or responsibility for injury or damages arising in connection there with.
This publication is for informational purposes only. Information contained herein is believed to be accurate, but has not been verified and cannot be guaranteed. Opinions represented are not intended as an offer or solicitation with respect to the purchase or sale of any security and are subject to change without notice. Statements in this material should not be considered investment advice or a forecast or guarantee of future results. To the extent specific securities are referenced herein, they have been selected on an objective basis to illustrate the views expressed in the commentary. Such references do not include all material information about such securities, including risks, and are not intended to be recommendations to take any action with respect to such securities. The securities identified do not represent all of the securities purchased, sold or recommended and it should not be assumed that any listed securities were or will prove to be profitable. Past performance is no guarantee of future results.
PNC Capital Advisors, LLC claims compliance with the Global Investment Performance Standards (GIPS®). A list of composite descriptions for PNC Capital Advisors, LLC and/or a presentation that complies with the GIPS® standards are available upon request.
PNC Capital Advisors, LLC is a wholly-owned subsidiary of PNC Bank N.A. and an indirect subsidiary of The PNC Financial Services Group, Inc. serving institutional clients. PNC Capital Advisors’ strategies and the investment risks and advisory fees associated with each strategy can be found within Part 2A of the firm’s Form ADV, which is available at https://pnccapitaladvisors.com.
©2023 The PNC Financial Services Group, Inc. All rights reserved.
FOR INSTITUTIONAL USE ONLY
INVESTMENTS: NOT FDIC INSURED-NO BANK GUARANTEE – MAY LOSE VALUE