Third Quarter Highlights
- U.S. Treasury (UST) yields surged higher during the quarter, broadly reaching the highest levels since 2007. Much of this increase was due to rising real rates, as reflected by Treasury Inflation-protected Security (TIPS) yields.
- Contrary to recent quarters, the increase in yields was more pronounced in longer-dated maturities, leading to a “dis-inversion” of the yield curve.
- The Federal Reserve (Fed) tightened monetary policy with a 25 basis point (bp) hike during the July Federal Open Market Committee (FOMC) meeting, bringing the policy rate target range to 5.25%-5.50%.
- While Fed officials chose not to adjust rates at the September FOMC meeting, they increased year-end projections for the fed funds rate for both 2024 and 2025 by 50 bps, reinforcing the “higher-for-longer” theme.
- The economy continues to demonstrate remarkable resiliency, largely powered by strong consumer spending that remains supported by robust labor markets
- Fitch Ratings downgraded U.S. sovereign debt to AA+, causing the Bloomberg index-equivalent rating to move in unison, drastically reducing the AAA-rated universe.
- Investment grade credit spreads were stable throughout the quarter, resulting in modestly positive excess returns.
Duration Positioning
Near Neutral
Modestly underweight duration by approximately 2% across strategies.
Credit Sector
Overweight
Overweight Financials, Utilities and select Industrial sectors, primarily within Energy-related sub-sectors. Underweight Health Care, Pharmaceuticals and Non-Corporate Credit.
Structured Products
Overweight
Maintain overweight in Asset-backed Securities (ABS) across short and intermediate strategies. Remain overweight in Agency Mortgage-backed Securities (MBS) across styles.
Third quarter throws a curve ball
The U.S. economy picked up steam in the third quarter as consumers remained largely unfazed by higher borrowing costs and persistent inflation. The trend of better-than-expected economic data raised hopes that a downturn could be avoided, even as the Fed stays committed to restrictive policy in an effort to bring inflation back toward its 2% target. After a cumulative 525 bps increase in the policy rate since the Fed’s current campaign started in 2022, future increases in the fed funds rate will likely become incrementally less effective as a policy tool. The Fed has instead shifted its focus to forward guidance, emphasizing a “higher-for-longer” message. Financial markets are generally aligned, as implied expectations for both the amount and timing of rate cuts in 2024 has moderated. The result has been a noticeably steeper — or less inverted — yield curve, as intermediate and long-dated Treasury yields jumped to cycle highs.
This steep increase in rates pushed the yield on the Bloomberg Aggregate Index to a 15-year high of 5.39% at quarter end, resulting in a -3.23% quarterly return. Year-to-date returns for the Index have now migrated into negative territory as well. Unless we see a fourth quarter rally, investors will face a third consecutive negative calendar year return.
Investment grade credit spreads ended the quarter modestly lower, allowing the sector to produce a positive excess return of 0.77% (Figure 1). Structured product performance was mixed as ABS generated positive returns, while Agency MBS materially underperformed due to the volatile rate environment. High yield spreads widened modestly but were still able to outperform investment grade given their higher carry profile.
Figure 1. Sector Comparison
Quarterly excess returns were generally positive, except for MBS
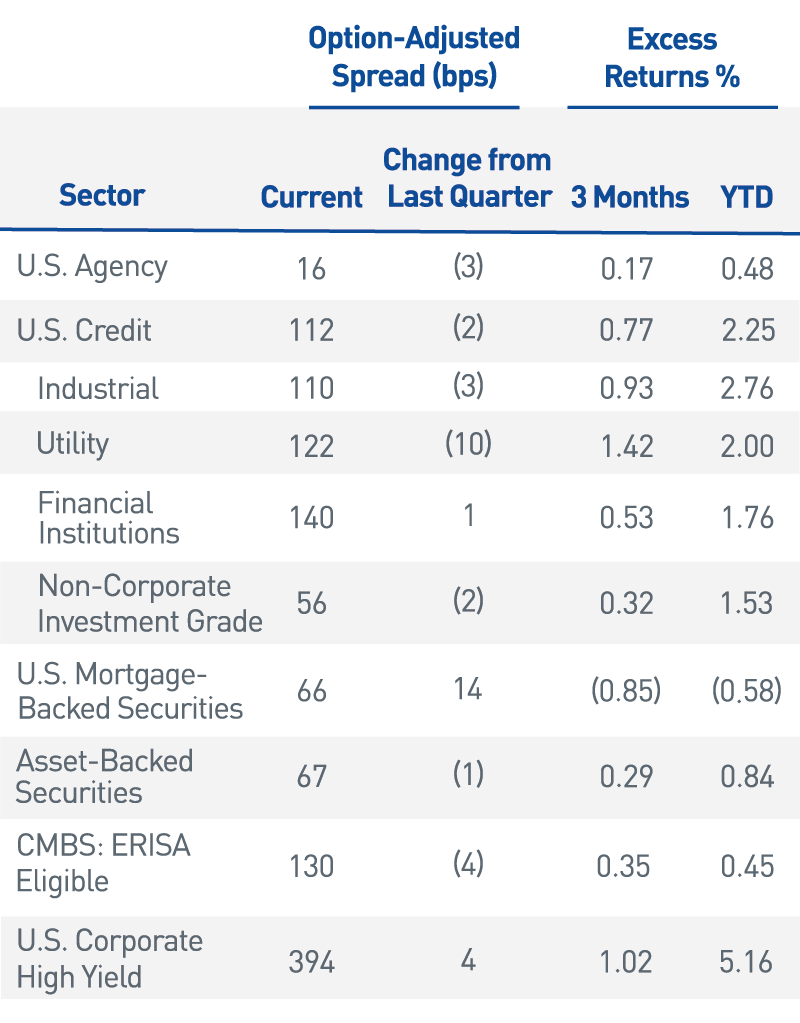
As of 9/30/2023. Source: Bloomberg L.P.
Telephone game: Is the Fed’s signal finally getting through?
As the Fed approaches the end of its policy tightening campaign, financial markets are trying to gauge not only where the long-term neutral rate will land, but also when the Fed might have flexibility to adjust rates lower. Thus far, the economy has avoided the pain Chair Powell suggested was likely necessary in August 2022. However, with rates expected to remain elevated for at least the next several quarters, it is reasonable to expect the impact of tighter financial conditions to become a more considerable headwind for the economy.
The Fed delivered an additional 25 bp hike at the July FOMC meeting but chose to hold rates steady at the September meeting, as widely expected. Instead, officials leaned into hawkish guidance, with an increase in the median fed funds rate forecast for year-end 2024 of 50 bps. While this surprised markets, it reflects the Committee’s determination to drive home the message of “higher for longer.”
The path of Fed policy remains data-driven, as the long and variable lags of rate increases continue to play out. Recent economic data has provided encouraging signs that inflation may moderate without serious economic damage and renewed hopes for a soft landing. This optimism centers on labor markets, which remain strong by virtually every measure. Strong labor, in turn, has powered consumer spending and economic activity, despite significantly higher borrowing costs. Regardless of this seemingly constructive environment, Chair Powell expressed a desire to “proceed carefully,” acknowledging concerns that the cumulative effect of rate hikes could still lead to a recession.
The reaction in interest rates following the September FOMC meeting has been dramatic, with a noticeable bear steepening in the yield curve. This sort of shift in the yield curve — where longer rates move materially higher — is somewhat atypical for this point in a cycle. Normally a steepening of the curve is driven by shorter-term rates as they begin anticipating a shift in policy.
Among the myriad potential drivers of the bear steepening, we believe it is due to a combination of factors: optimistic expectations for growth, increased Treasury supply, reduced demand from foreign investors and/or the ongoing impact of the Fed’s balance sheet reduction. However, as it relates to future monetary policy decisions, recent comments from a number of Fed presidents indicate that higher longer-term rates could be a possible substitute for additional rate hikes. Indeed, many FOMC members have acknowledged not only the progress resulting from the Fed’s moves so far, but also the risk in preemptively over-tightening without fully considering the lagged effects of policy adjustments. While far from declaring victory, Chair Powell has shown a sense of hopefulness that policy changes are proving successful given the material catch-up that was required a year ago as inflation hit multi-decade highs.
Rates: Reality bites
While elevated interest rate volatility and the rapid evolution of the yield curve garner most of the market’s attention, the surge in real rates is less discussed despite presenting a material headwind for the investment environment and financial conditions. As shown in Figure 2, stability in the breakeven rate on 10-year TIPS belies the recent, dramatic increase in yield. Global central banks have suppressed nominal and real yields through policy accommodation, including quantitative easing programs, throughout much of the last 15 years. This has resulted in abundant liquidity, low rates and easy lending conditions, which makes recent policy adjustments more challenging for investors to digest. Market participants will continue to adapt to these more restrictive conditions, which could present growth headwinds for 2024 and beyond. It is important to remember that should inflation continue to moderate while the Fed maintains its current policy stance, the real fed funds rate will rise and act to further restrict financial conditions.
Figure 2. 10-Yr TIPS Yield vs. 10-Yr Breakeven Inflation Rate
While real rates have surged, breakeven inflation has been noticeably stable
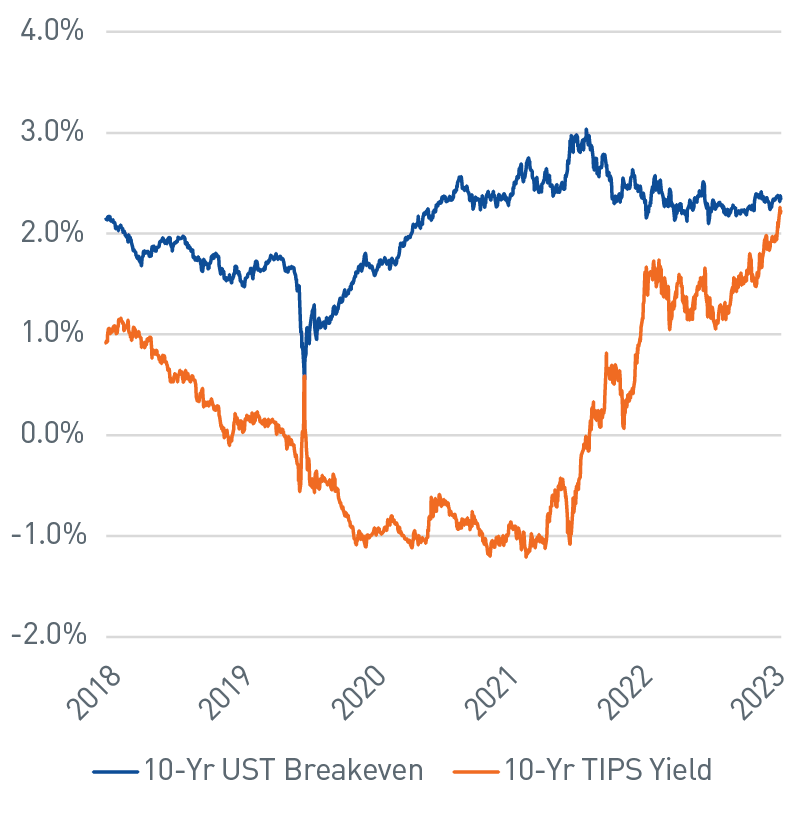
As of 9/30/2023. Source: Bloomberg L.P.
Higher rates and the Fed’s forward guidance have helped support strength in the U.S. dollar, presenting headwinds for foreign buyers from currency hedging-related costs. In addition, the global yield landscape no longer requires U.S. dollar-based assets to hit investment bogeys. With waning demand, U.S. interest rates have the potential to remain elevated, particularly when considering the condition of the United States’ finances.
Fiscal policy: Hoping to avoid additional own goals
Markets are generally accustomed to tuning out the rhetoric in Washington, D.C. as it relates to debt ceiling battles; however, potential impacts of the sizeable fiscal deficit have been garnering recent attention. Bloated deficits — now exceeding $1 trillion — are a growing concern for supply/demand dynamics in the U.S. Treasury market. As yields approach the highest levels in more than 15 years, debt servicing costs will be pressured higher, consuming an increasing share of the federal budget (Figure 3). Proactive measures to address tax or spending policy gaps appear unlikely given the high level of discord within Congress. Fitch Ratings’ recent U.S. credit rating downgrade from “AAA” to “AA+” called out this disfunction as a driver in their decision (see our publication, Migratory Patterns). Moody’s Investors Service has also issued a warning that they are increasingly concerned about the “U.S. institutional and governance strength relative to other Aaa-rated sovereigns.” While Moody’s made no official changes to their outlook, it is clear rating agencies are becoming more outspoken in their assessment of fiscal policymakers and the persistent gridlock in Washington. Increased issuance will continue to put upward pressure on U.S. rates, particularly in the context of tightening policy among developed market central banks.
Figure 3. U.S. Treasury Total Public Debt vs. Annual Interest Payments, $ billions
Increased borrowing costs garner investor attention
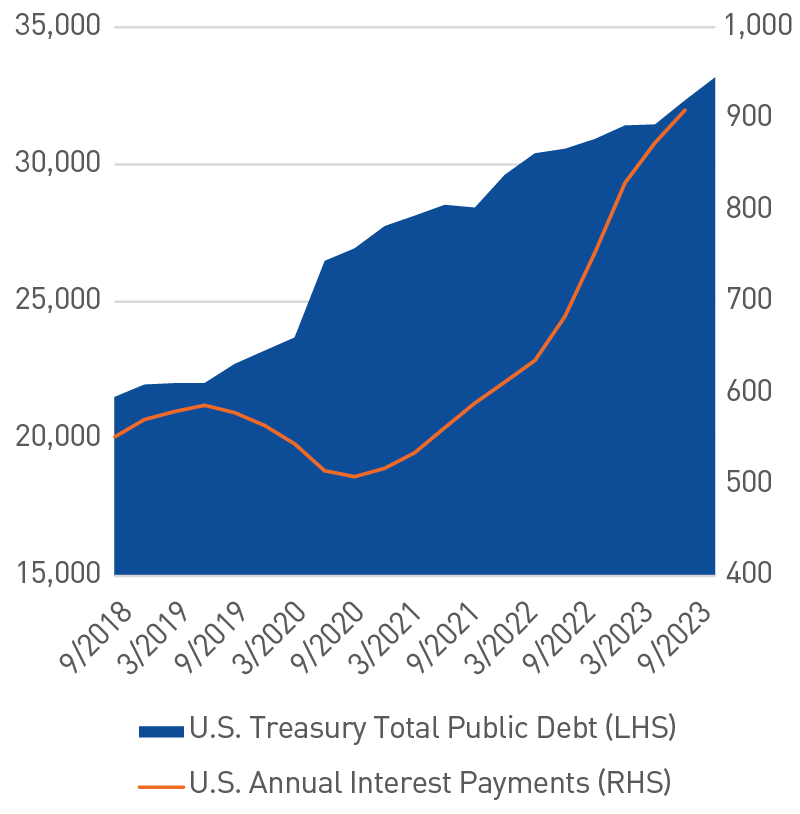
As of 9/30/2023. Source: Bureau of Economic Analysis, Bloomberg L.P.
Positioning & outlook: More tricks than treats
As 2023 has unfolded, the investment environment has become increasingly challenged. All four pillars of our market outlook — monetary policy, fiscal policy, inflation and volatility — have become headwinds, at times conspiring with one another to cause bouts of dislocation. While Fed officials are likely close to the end of their tightening campaign, rates will remain elevated for the foreseeable future. At the same time, ongoing quantitative tightening is draining liquidity from the system. We expect the contentious political environment and lack of constructive discourse on Capitol Hill to impede progress on addressing the country’s growing fiscal imbalances. While inflation dynamics have improved, levels remain elevated and well above longer-term Fed targets, which will likely require continued policy restraint. Additionally, we expect rate volatility to remain high as the market finally accepts the Fed’s “higher-for-longer” policy guidance and supply/demand imbalances grow.
With so many competing variables, we are maintaining a defensive posture across portfolio strategies as we carefully weigh risk-return outcomes. That said, the symmetry of total return has improved markedly as the yield to worst on the Bloomberg Aggregate index approaches 5.5%. As we have shown, a starting yield in this area has produced an average annual return of 5.65% over the subsequent five years (see our publication, Take a Bite out of the Curve).
Credit spreads have been remarkably resilient given rate volatility and, in our opinion, are fairly valued. However, looking more closely across Credit markets, we would highlight the stark difference in valuations between Financials and Industrials, supporting our overweight within the banking sector since the crisis in March (Figure 4). Our emphasis continues to be focused on the largest globally systemically important banks (G-SIBs) along with select regional banks subject to higher regulatory oversight. There has also been bifurcation in the movement of spreads along the yield curve. Credit curves are relatively steep in short and intermediate maturities, while long-duration credit spreads have materially tightened, limiting the attractiveness in that portion of the credit curve.
Figure 4. Ratio of Intermediate Financials OAS to Intermediate Industrials OAS
Financials remain cheap relative to Industrials on a historical basis
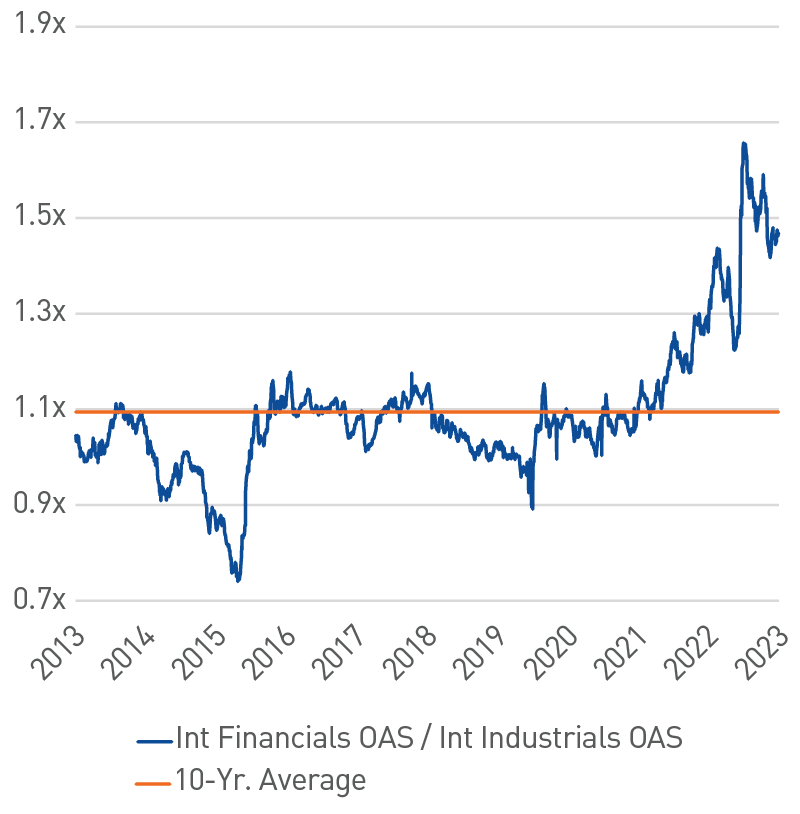
As of 9/30/2023. Source: Bloomberg L.P., PNC Capital Advisors
Structured Products continue to be compelling, as an uptick in recent issuance has caused ABS valuations to modestly cheapen in recent weeks. We continue to favor Structured Products and have found attractive opportunities to maintain significant overweights in short and intermediate strategies.
The struggle is real in the MBS market, which continues to bear the brunt of the highly volatile interest rate environment. The sector has been a relative underperformer year to date. Historically wide spreads, attractive convexity profiles and improved supply dynamics should, at some point, result in attractive returns for the space — but rate stability is a necessary catalyst. Given the current backdrop, we believe we are being well compensated for our sector overweights but continue to exhibit patience in making additional allocations within client portfolios.
Important Disclosures
Indices
The Bloomberg US Aggregate Bond Index is a broad-based benchmark that measures the investment grade, U.S. dollar-denominated, fixed-rate taxable bond market. The index includes Treasuries, government-related and corporate securities, MBS (agency fixed-rate and hybrid ARM pass-throughs), ABS and CMBS (agency and nonagency).
The Bloomberg US Aggregate Corporate Index represents the total return measure of the corporates portion of the Barclays U.S. Aggregate Index.
The Bloomberg US Credit Index measures the investment grade, US dollar-denominated, fixed-rate, taxable corporate and government related bond markets. It is composed of the US Corporate Index and a non-corporate component that includes foreign agencies, sovereigns, supranationals and local authorities.
The Bloomberg U.S. Corporate High Yield Index measures the performance of USD-denominated, non-investment grade, fixed rate, taxable corporate bonds, including corporate bonds, fixed-rate bullet, putable, and callable bonds, SEC Rule 144A securities, Original issue zeroes, Pay-in-kind (PIK) bonds, Fixed-rate and fixed to-floating capital securities.
The Consumer Price Index (CPI) is a measure of the average change over time in the prices paid by urban consumers for a market basket of consumer goods and services.
BLOOMBERG® and the Bloomberg indices are service marks of Bloomberg Finance L.P. and its affiliates, including Bloomberg Index Services Limited (“BISL”), the administrator of the index (collectively, “Bloomberg”) and have been licensed for use for certain purposes by PNC Capital Advisors LLC. (PCA). Bloomberg is not affiliated with PCA, and Bloomberg does not approve, endorse, review, or recommend this material. Bloomberg does not guarantee the timeliness, accurateness, or completeness of any data or information relating to the information herein.
This publication is for informational purposes only. Information contained herein is believed to be accurate, but has not been verified and cannot be guaranteed. Opinions represented are not intended as an offer or solicitation with respect to the purchase or sale of any security and are subject to change without notice. Statements in this material should not be considered investment advice or a forecast or guarantee of future results. To the extent specific securities are referenced herein, they have been selected on an objective basis to illustrate the views expressed in the commentary. Such references do not include all material information about such securities, including risks, and are not intended to be recommendations to take any action with respect to such securities. The securities identified do not represent all of the securities purchased, sold or recommended and it should not be assumed that any listed securities were or will prove to be profitable. Past performance is no guarantee of future results.
PNC Capital Advisors, LLC claims compliance with the Global Investment Performance Standards (GIPS®). A list of composite descriptions for PNC Capital Advisors, LLC and/or a presentation that complies with the GIPS® standards are available upon request.
PNC Capital Advisors, LLC is a wholly-owned subsidiary of PNC Bank N.A. and an indirect subsidiary of The PNC Financial Services Group, Inc. serving institutional clients. PNC Capital Advisors’ strategies and the investment risks and advisory fees associated with each strategy can be found within Part 2A of the firm’s Form ADV, which is available at https://pnccapitaladvisors.com.
©2023 The PNC Financial Services Group, Inc. All rights reserved.
FOR INSTITUTIONAL USE ONLY
INVESTMENTS: NOT FDIC INSURED-NO BANK GUARANTEE – MAY LOSE VALUE