Third Quarter Highlights
- At its September 16 meeting, the Federal Open Market Committee (FOMC) raised the federal funds target range to 3.75%—4.00%. Although an increase was widely expected, the meeting's tone and Federal Reserve (Fed) Chair Warsh's post-meeting press conference were more hawkish than markets had anticipated.
- FOMC projections continue to indicate an upward bias for the fed funds rate: 16 of 18 participants anticipate at least one additional 25-basis-point (bp) increase this year, while four project two further increases by the end of 2026.
- U.S. Treasury (UST) yields drifted modestly higher throughout much of the summer, then surged from late August through September, pushing longer maturities to levels not seen since the early 2000s.
- Despite somewhat softer labor market conditions and deteriorating consumer confidence, economic growth remains supported by strong business investment, particularly in technology infrastructure spending.
- Investment-grade (IG) credit spreads remained relatively stable during the quarter, despite heightened interest-rate volatility and persistent geopolitical uncertainty, which underscored the resilience of underlying market fundamentals.
- IG issuance remains robust, fueled by AI investments and M&A financing. Strong investor demand has helped absorb the new supply, enabling companies to price debt with modest new-issue concessions.
- Mortgage-backed securities (MBS) underperformed amid persistent interest-rate volatility. September was a particularly weak month, with excess returns of -96 bps, the sector's worst monthly result in more than three years.
Duration Positioning
Neutral
Remain neutral on duration positioning given balanced yield and return symmetry.
Credit Sector
Modest underweight
Valuations remain expensive across most subsectors. Strategies are overweight banking and technology, while underweight capital goods, insurance and non-corporate credit.
Structured Products
Overweight
Allocations in asset-backed securities (ABS) remain overweight relative to benchmarks. Positioning within agency MBS remains overweight across both aggregate and non-aggregate styles.
Third Quarter Market Summary
UST yields rose sharply in the third quarter as investors recalibrated expectations for inflation, monetary policy, economic growth and federal borrowing needs. Fed Chair Warsh reinforced a more hawkish policy outlook in both his speech at the late-August Jackson Hole Economic Policy Symposium and again following the September FOMC meeting, at which the Committee tightened policy for the first time in more than three years.
The UST rate selloff pushed the yield to worst on the Bloomberg U.S. Aggregate Bond Index (the Agg) up to 5.56%, resulting in a negative 3.51% total return. Changes in risk premia were relatively subdued, with the option-adjusted-spread (OAS) for the Agg widening 5 bps to 31 bps.
The spike in rate volatility weighed heavily on MBS, which experienced excess returns of -1.16% and significantly underperformed other IG sectors. ABS was the only sector to achieve positive excess returns, buoyed by its short duration and high-quality attributes (Figure 1).
Figure 1. Third Quarter Excess Returns, Bloomberg U.S. Aggregate and U.S. Corporate High Yield Indices
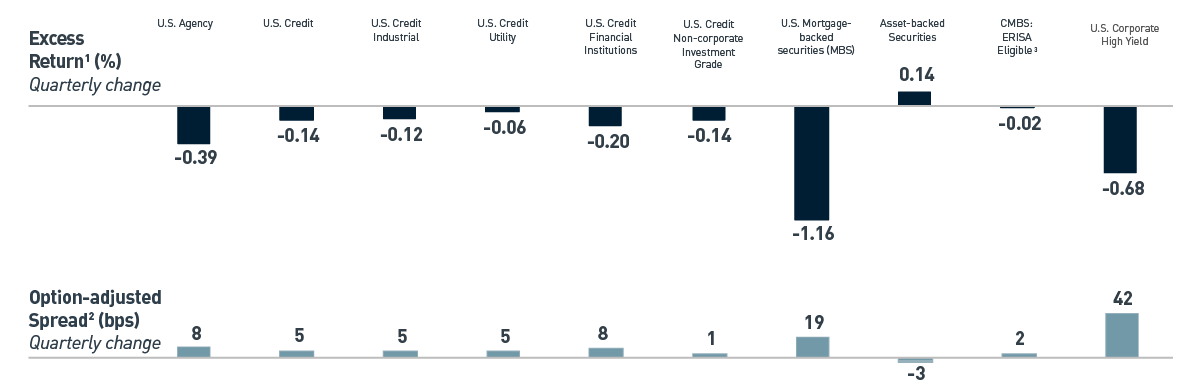
As of 9/30/2026. Source: Bloomberg L.P. View accessible version of chart.
1 Excess return: Shows the excess total return of each index/component of the index relative to the duration-matched UST Index.
2 OAS of the Bloomberg U.S. Aggregate Index.
3 CMBS: Commercial Mortgage-Backed Securities; ERISA: Employee Retirement Income Security Act of 1974
Monetary and Fiscal Policy — Competing Agendas
At the Fed's Jackson Hole Economic Policy Symposium, Chair Warsh emphasized that inflation remaining above the Fed's 2% objective requires policymakers to have a predominant focus on price stability. He also asserted that prevailing financial conditions were not meaningfully restrictive, implying that the current policy stance was not sufficiently tight to return inflation sustainably to target. The market reaction was swift, with the UST selloff accelerating from late August through September as the projected path of policy rates shifted higher (Figure 2). Rate volatility spiked in tandem with yields, reflecting greater uncertainty around both the timing and magnitude of additional tightening.
Figure 2. UST Yield Curve Changes by Maturity
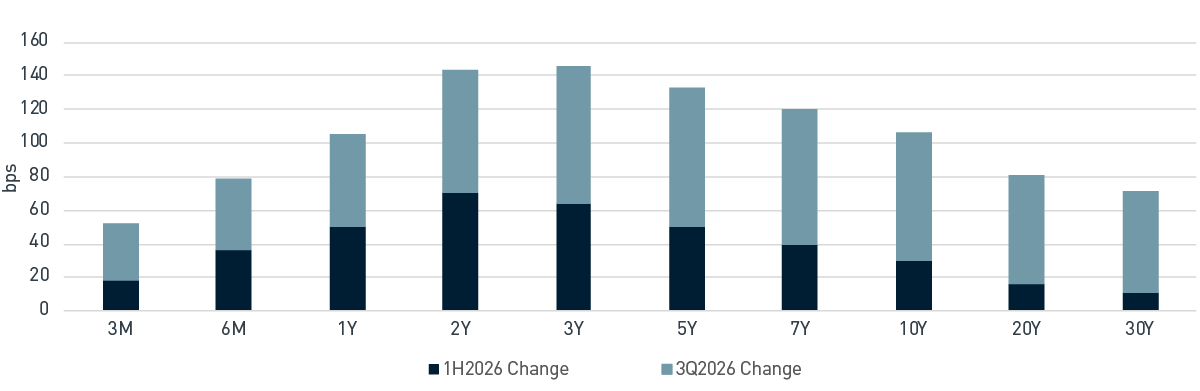
As of 9/30/2026. Source: Bloomberg L.P. View accessible version of chart.
While the market had discounted the FOMC's rate hike at the September meeting, Chair Warsh's post-meeting press conference comments were considerably more hawkish and built on his speech at Jackson Hole. Warsh described the hike as “removing accommodation,” which suggests he viewed the neutral rate for the economy as trending higher. The Fed's Summary of Economic Projections illustrated that 16 of 18 participants anticipated at least one additional 25-bp increase in 2026, including four who projected two further increases. Forecasts for the next several years also suggested a need for tighter policy: the median participant projected no cuts in 2027 and a policy rate above the longer-term “neutral” rate through 2029.
The Fed is confronting supply-side pressures that are impacting supply chains and input costs during a period of robust capital investment. These pressures include tariffs, higher prices for oil, refined products, feedstock and agricultural commodities, as well as elevated transportation and shipping costs. When these shocks occur in succession after inflation has exceeded target for such an extended period, policymakers have less latitude to treat them as temporary.
From a fiscal policy perspective, Treasury Secretary Scott Bessent has assumed a more active role in global capital markets in an effort to help limit further increases in longer-term UST yields. In July, Secretary Bessent coordinated a currency intervention to support the yen and alleviate pressure for policymakers in Japan to sell USTs. Then, in August, he announced a significant expansion of UST buybacks, a program designed to regularly repurchase USTs to support market liquidity. Later, Secretary Bessent reaffirmed these policies by declaring “I am the house now” in September, an apparent challenge to capital markets to test his resolve. That said, many investors remain skeptical that these policy actions will be effective tools in managing the yield curve.
Portfolio Positioning — Favorable Yield Symmetry
During the quarter, significant corporate issuance created select opportunities to add exposure through new-issue concessions and steeper credit curves. Valuations remain expensive, so we seek to maintain a generally neutral risk position, preserving our capacity to add exposure should risk premia become more compelling. That said, higher yields broadly may help to limit spread widening, as all-in yields are compelling. As of September 30, the yield to worst was 6.04% for the Bloomberg U.S. Corporate Index and 8.35% for the Bloomberg Corporate High Yield Index, offering a competitive alternative to equities and attractive return symmetry.
MBS ended the quarter under significant pressure as the persistent rise in rates and a spike in volatility pushed spreads wider. The sector generated an excess return of -96 bps in September, its weakest monthly performance since September 2023. Relative underperformance was broadly consistent across the coupon stack over the past three months, although 15-year pools materially outperformed 30-years. After quarter end, the market has stabilized somewhat but has continued to trade cautiously.
Production-coupon spreads widened approximately 15 bps during the month, to 129 bps more than USTs, the widest level of the year. At the same time, the 30-year fixed mortgage rate increased to 7.3%, which has effectively removed refinancing incentives, extended index duration by nearly half a year to approximately six years, while further weighing on housing market turnover.
Until rates stabilize, the MBS market is likely to remain challenged in our view, as duration and convexity concerns continue to outweigh otherwise compelling relative value. Technicals remain supported by low organic supply and the potential for government-sponsored enterprise (GSE) support. Despite the White House's January directive authorizing the GSEs to increase their balance sheets by $200 billion, year-to-date purchase activity has trended below street estimates. Additions slowed in May but current spreads may incentivize an increase in activity.
ABS have delivered strong year-to-date performance and outperformed high-quality credit with less volatility, fulfilling their intended role in portfolios, where we remain overweight (Figure 3). This dynamic has occurred despite robust new issuance that is steadily outpacing last year's supply.
Figure 3. Year-to-date Rolling Excess Returns: ABS vs. Short Credit
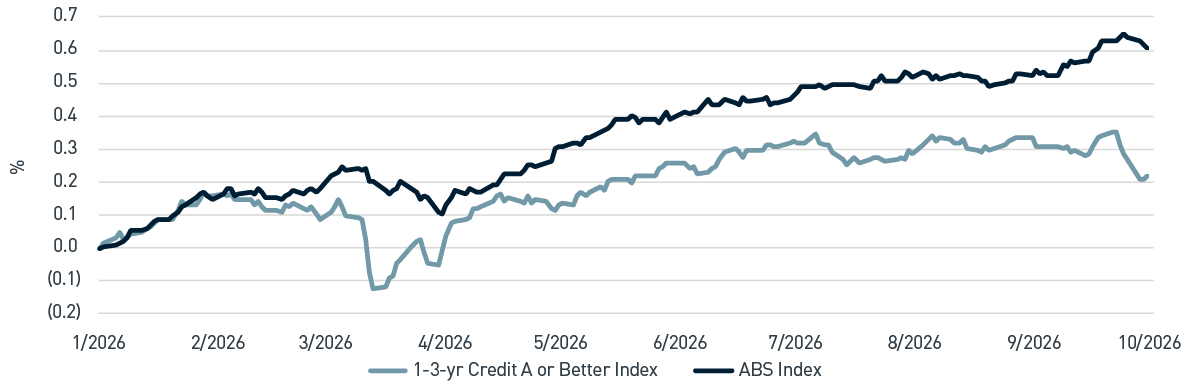
As of 9/30/2026. Source: Bloomberg L.P. View accessible version of chart.
Outlook — A Confluence of Challenges
Looking ahead, financial markets are eager for the recent volatility in global bond markets to abate. Domestically, the rise in UST yields has been driven primarily by higher real rates and an increase in term premia as TIPS break-evens have remained relatively stable (Figure 4). This dynamic suggests that markets are increasingly expecting the Fed to not only tighten policy further, but also to keep rates elevated for longer to contain inflation.
Figure 4. Year-to-date UST Yield Change
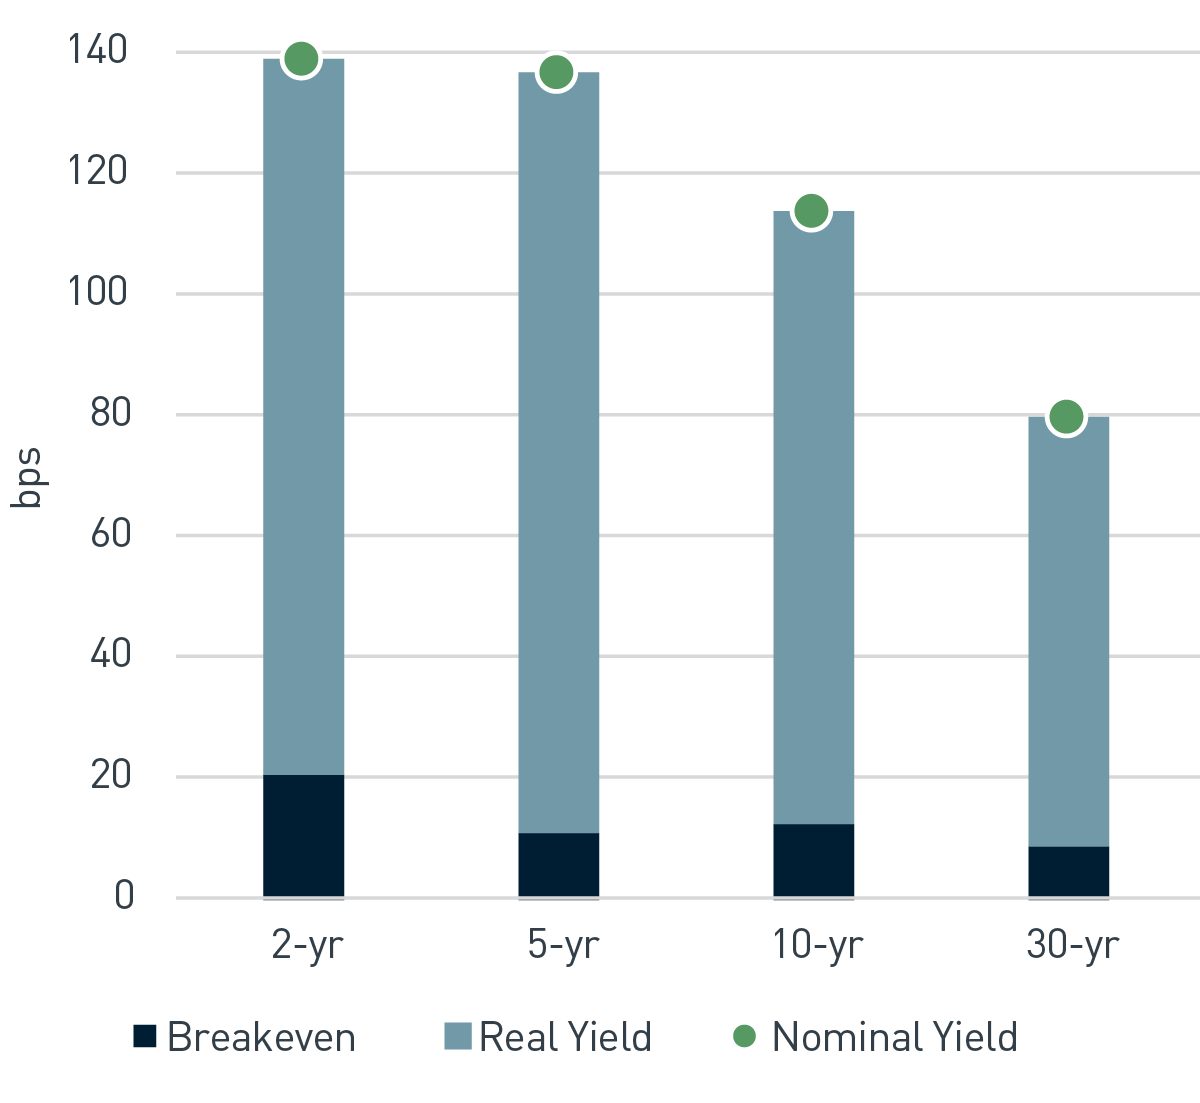
As of 9/30/2026. Source: Bloomberg L.P. View accessible version of chart.
Resilient growth and robust capital investment, particularly in technology infrastructure, are increasing demand for capital and reinforcing the case for restrictive policy. At the same time, policymakers must weigh the near-term inflationary pressures associated with surging AI-related investment against the potential for longer-term productivity gains to improve supply and moderate inflation.
The labor market presents a more mixed outlook. The unemployment rate has remained steady, and monthly job growth near 50,000 appears sufficient to keep it stable. However, the continued rise in long-term unemployment points to underlying weakness. Workers are finding it more difficult to enter or reenter the labor force, and job gains remain concentrated in healthcare and social services, conditions that are not fully consistent with otherwise robust economic growth.
Against this backdrop, we expect episodic interest-rate volatility and favor more tactical adjustments to portfolio positioning. Given yield symmetry, we believe a neutral duration position is warranted, while we source selective exposure to corporate credit. We also maintain that an overweight to structured products can offer opportunities to enhance income and improve total return. At current spreads, the agency MBS sector offers a more attractive excess return profile after recent underperformance, but a more durable opportunity will likely require greater stability in rates.
The higher yield environment has improved the opportunity set for fixed income investors by creating more favorable return symmetry. The carry benefit can provide meaningful protection in short- and intermediate-duration strategies, reducing the likelihood of outright losses over a one-year holding pattern even if rates rise further (Figure 5).
Figure 5. 12-mo. Total Returns in Different Interest Rate Scenarios*
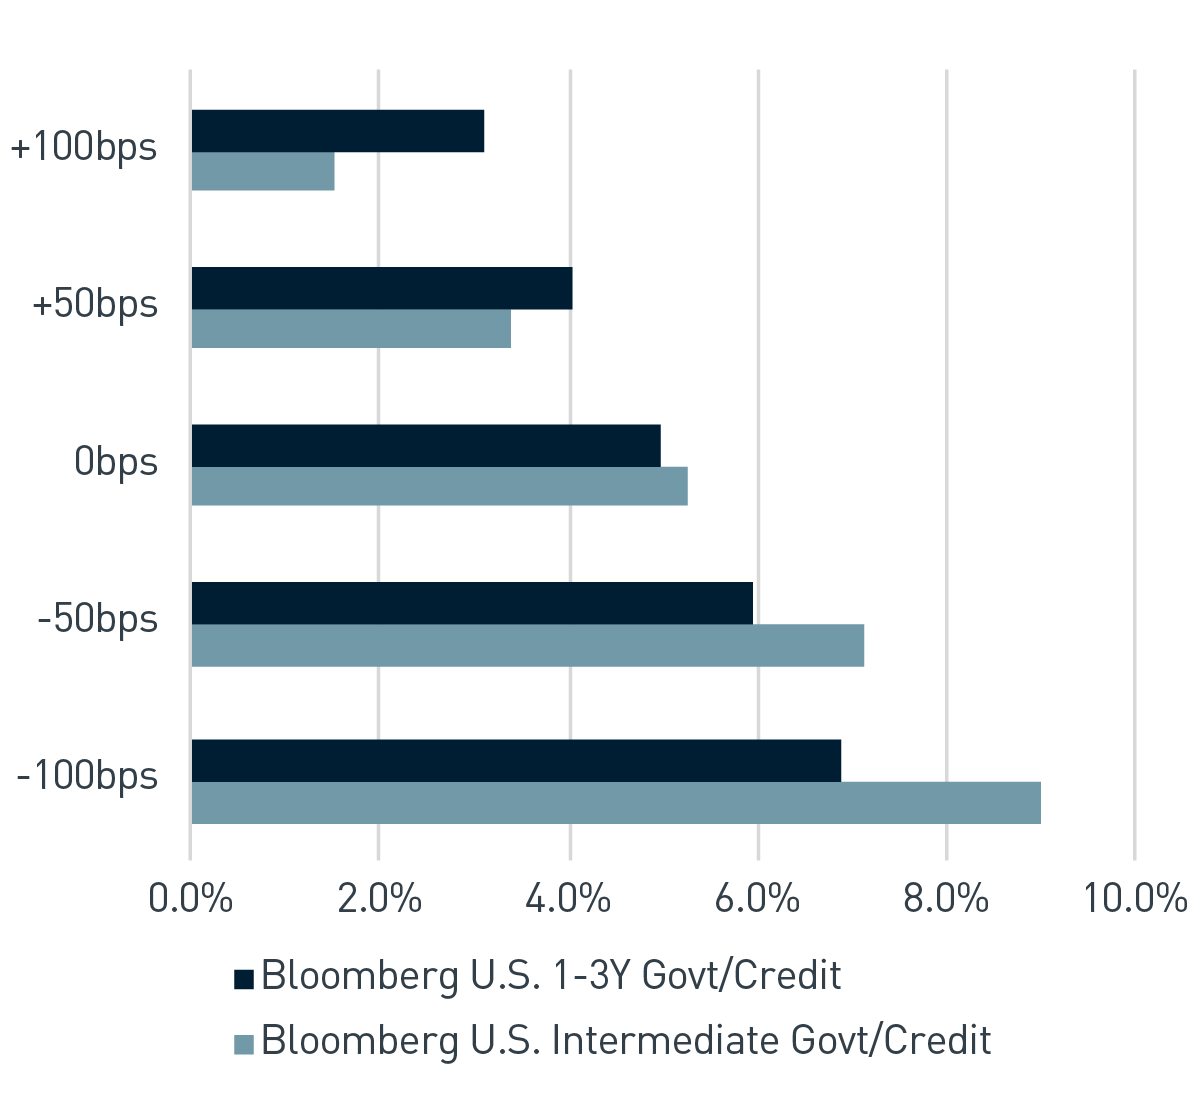
As of 9/30/2026. *Assumes a parallel shift in the yield curve. Source: Bloomberg L.P. View accessible version of chart.
Figure 1. Third Quarter Excess Returns, Bloomberg U.S. Aggregate and U.S. Corporate High Yield Indices
| Category |
Excess Returns Quarter (%) |
Option-adjusted Spread, Quarterly Change (bps) |
| U.S. Agency |
-0.39 |
8 |
| U.S. Credit |
-0.14 |
5 |
| U.S. Credit Industrial |
-0.12 |
5 |
| U.S. Credit Utility |
-0.06 |
5 |
| U.S. Credit Financial Inst. |
-0.20 |
8 |
| U.S. Credit Non-corporate Investment Grade |
-0.14 |
1 |
| MBS |
-1.16 |
19 |
| Asset-backed Securities |
0.14 |
-3 |
| CMBS: ERISA Eligible |
-0.02 |
2 |
| U.S. Corporate High Yield |
-0.68 |
42 |
Figure 2. UST Yield Curve Changes by Maturity
| Date |
1H2026 Change (bps) |
3Q2026 Change (bps) |
| 3M |
18.41 |
34.35 |
| 6M |
36.78 |
41.76 |
| 1Y |
50.47 |
54.59 |
| 5Y |
50.13 |
82.71 |
| 10Y |
29.82 |
76.25 |
| 20Y
|
15.59 |
64.55 |
Figure 3. Year-to-date Rolling Excess Returns: ABS vs. Short Credit
| Date |
1-3 Year Credit A or Better Index |
ABS Index |
| 1/2026 |
0.0 |
0.0 |
| 3/2026 |
0.1 |
0.2 |
| 5/2026 |
0.1 |
0.3 |
| 7/2026 |
0.3 |
0.4 |
| 9/2026 |
0.3 |
0.5 |
Figure 4. Year-to-date UST Yield Change
| Duration |
Breakeven (bps) |
Real Yield (bps) |
Nominal Yield (bps) |
| 2Y |
20.07 |
118.86 |
138.93 |
| 5Y |
10.76 |
126.15 |
136.91 |
| 10Y |
12.45 |
101.55 |
114 |
| 30Y |
8.42 |
70.83 |
79.25 |
Figure 5. 12-mo. Total Returns in Different Interest Rate Scenarios
| Rate (bps) |
Bloomberg U.S. 1-3Y Govt/Credit (%) |
Bloomberg U.S. Intermediate Govt/Credit (%) |
| +100 |
3.09 |
1.50 |
| +50 |
4.03 |
3.37 |
| 0 |
4.98 |
5.25 |
| -50 |
5.93 |
7.13 |
| -100 |
6.87 |
9.01 |
Important Disclosures
Index definitions are available at https://www.pnccapitaladvisors.com/index-definitions/
This publication is for informational purposes only. Information contained herein is believed to be accurate, but has not been verified and cannot be guaranteed. Opinions represented are not intended as an offer or solicitation with respect to the purchase or sale of any security and are subject to change without notice. Statements in this material should not be considered investment advice or a forecast or guarantee of future results. To the extent specific securities are referenced herein, they have been selected on an objective basis to illustrate the views expressed in the commentary. Such references do not include all material information about such securities, including risks, and are not intended to be recommendations to take any action with respect to such securities. The securities identified do not represent all of the securities purchased, sold or recommended and it should not be assumed that any listed securities were or will prove to be profitable. Past performance is no guarantee of future results.
PNC Capital Advisors, LLC claims compliance with the Global Investment Performance Standards (GIPS®). A list of composite descriptions for PNC Capital Advisors, LLC and/or a presentation that complies with the GIPS® standards are available upon request.
PNC Capital Advisors, LLC is a wholly-owned subsidiary of PNC Bank N.A. and an indirect subsidiary of The PNC Financial Services Group, Inc. serving institutional clients. PNC Capital Advisors' strategies and the investment risks and advisory fees associated with each strategy can be found within Part 2A of the firm's Form ADV, which is available at https://pnccapitaladvisors.com.
©2026 The PNC Financial Services Group, Inc. All rights reserved.
FOR INSTITUTIONAL USE ONLY
INVESTMENTS: NOT FDIC INSURED-NO BANK GUARANTEE – MAY LOSE VALUE