Second Quarter Highlights
- At its June 17 meeting, the Federal Open Market Committee (FOMC) held rates steady, marking the fourth consecutive meeting without a policy rate change. A trimmed-down post-meeting statement emphasized the FOMC's commitment to lowering inflation, which remains elevated.
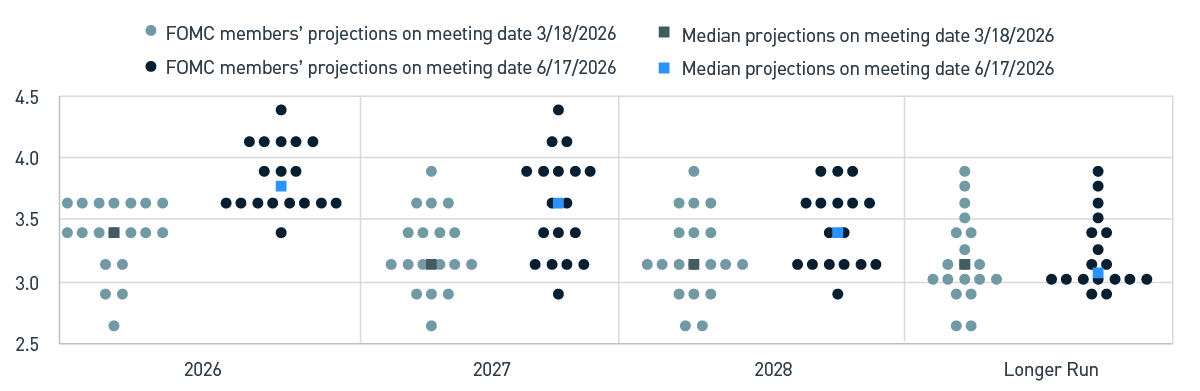
- The median fed funds rate projection for 2026 was revised higher to 3.8%, and nine participants forecast a rate hike this year.
- New Federal Reserve (Fed) Chair Kevin Warsh announced five task forces to assess several Fed initiatives. Communication strategies are a particular focus area as Chair Warsh has previously expressed a desire for forward guidance to serve a diminished role.
- Improved labor market data and robust capital expenditures support expectations for a continuation of solid economic growth.
- Headline inflation has moved sharply higher, primarily driven by energy prices. Core inflation measures have increased as well and appear likely to remain closer to 3% in the coming months.
- Investment-grade (IG) credit spreads moved back to the lows of the year, showing resiliency in the face of geopolitical uncertainty and record new issue supply.
- Artificial intelligence (AI)-driven capital investments continue to fuel large corporate bond sales, which represent a growing share of the IG market.
Duration Positioning
Neutral
Remain neutral on duration positioning given balanced yield and return symmetry.
Credit Sector
Shifting from neutral to underweight
Improved valuations in the first quarter proved temporary, and warranted a reduction in corporate credit allocations in the second quarter. Within subsectors, strategies are overweight banking and technology, media and telecom, while underweight capital goods, insurance and non-corporate credit.
Structured Products
Overweight
Allocations in asset-backed securities (ABS) remain overweight relative to benchmarks. Positioning within agency mortgage-backed securities (MBS) remains overweight across both Aggregate and Non-aggregate styles.
Second Quarter Market Summary
Moderating geopolitical tensions in the Middle East have aided the recent decline in oil prices and reduced concerns about a prolonged energy shock. Although the Iran conflict persists and a durable peace agreement remains elusive, fixed income markets have increasingly looked past the headlines and shifted focus to the favorable macroeconomic backdrop. Improved labor market trends and strong corporate earnings have fostered expectations for continued economic growth. Meanwhile, new Fed Chair Kevin Warsh emphasized a strong commitment to lowering inflation at the June FOMC meeting, which helped alleviate prior notions that he had a bias toward easier monetary policy.
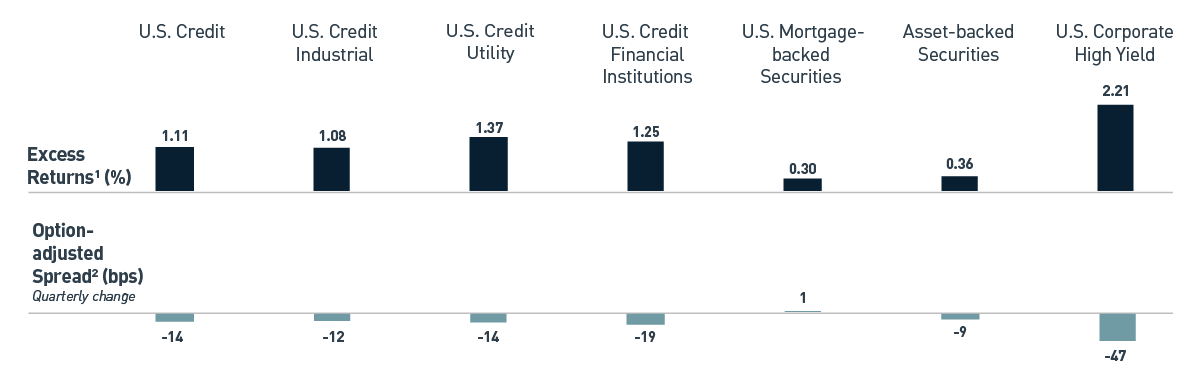
During the second quarter, the yield curve bear-flattened as the rise in shorter-dated U.S. Treasury (UST) yields outpaced the increase in longer maturities. The yield-to-worst on the Bloomberg U.S. Aggregate Bond Index increased 16 basis points (bps) to 4.73%, while the index had a total return of 0.67%. IG credit spreads fell by 14 bps and left the Bloomberg U.S. Credit Index's option-adjusted spread (OAS) at 69 bps, which resulted in positive excess returns of 1.11% (Figure 1). Securitized sectors also performed well, with excess returns on ABS and MBS of 36 bps and 30 bps, respectively.
Figure 1. Second Quarter Excess Returns, Bloomberg U.S. Aggregate and U.S. Corporate High Yield Indices
As of 6/30/2026. Source: Bloomberg L.P. View accessible version of chart.
1 Excess return: Shows the excess total return of each index/component of the index relative to the duration-matched UST Index.
2 OAS of the Bloomberg U.S. Aggregate Index.
Monetary Policy — New Fed Chair, Same Inflation Problems
Many investors were surprised by Chair Warsh's more hawkish tone at the June FOMC meeting, as he underscored the Committee's commitment to prioritizing price stability. The Fed's Summary of Economic Projections (SEP) illustrated a similar bias, with a notable increase in expectations for inflation and the near-term path for the fed funds rate. UST yields responded by rising sharply, particularly in shorter-dated maturities, which are more sensitive to changes in the fed funds rate. The SEP also showed that nine members of the FOMC anticipate a higher fed funds rate by year end, with six members projecting multiple rate hikes (Figure 2).
Figure 2. FOMC Dot Plot Evolution
As of 6/30/2026. Source: Bloomberg L.P., U.S. Federal Reserve View accessible version of chart.
Notably, Chair Warsh did not submit his own projection, in support of his view that reducing reliance on forward guidance would provide the Fed with greater flexibility and that it would help avoid signaling a predetermined policy path. He also announced the creation of five task forces that will assess a range of strategic initiatives, one of which will be focused on reviewing and potentially overhauling the Fed's communication strategy.
Concerns about the labor market, which surfaced last fall, have lessened as the unemployment rate eased back to 4.2% in June. While modest, average monthly payroll gains moved up during the first half of the year and other indicators of employment conditions suggest a “lower hire, lower fire” environment remains delicately balanced. This phenomenon is affording the Fed greater flexibility to focus on the other primary leg of its mandate: price stability. Inflation, which has continued to trend higher in recent months following the start of the Iran conflict, has shown some indications of becoming more broad-based. In addition to higher energy prices, other factors include shortages tied to surging AI-related investments and persistent supply-chain disruptions in commodity markets. Some of these influences are pressuring the trimmed-mean inflation statistics which Chair Warsh has suggested may give the Committee better visibility into underlying trends.
Portfolio Positioning — Tech Dominance Extends to Corporate Bond Marketss
After increasing credit weights in the first quarter as valuations became more attractive, we reduced exposure in the second quarter as spreads rallied back to multi-decade lows. This reduction has brought strategies back to an underweight allocation, relative to benchmarks on a contribution to duration basis. Spread compression has occurred despite corporate issuance remaining highly active; first-half volume matched the record pace set in 2020.
Large technology deals issued to fund capital investments continue to be a significant driver of the overall supply. Given the substantial size and frequent nature of this technology-related issuance, there have been opportunities for which new issue pricing has offered attractive concessions relative to existing holdings. We have primarily leveraged this dynamic as an opportunity for tactical portfolio rotations to readjust issuer exposure.
We believe it is important to carefully evaluate the likelihood of future issuance trends as the current investment cycle is forecasted to remain highly cash-flow-intensive for the foreseeable future, with total investments measured in trillions of dollars. While issuers have been largely successful in issuing debt so far, there has been some fatigue from investors in recent deals. Of late, order books have become less oversubscribed as investors consider how much exposure they can allocate to certain issuers, even if they carry high credit ratings. Additionally, some new issues have not performed well in the secondary market, trading back from where they were initially priced. While it is anticipated that issuers will continue to rely on IG markets, some have turned toward alternative methods, such as equity issuance and off-balance sheet project financing.
We continue to favor securitized markets, in which MBS and ABS remain overweight allocations for our strategies as both sectors continue to offer reasonable relative value. Despite recurring interest rate volatility, MBS has proven to be resilient so far this year as fundamentals remain supported by low net issuance and moderate prepayments. Similarly, the technical environment for mortgages continues to benefit from the $200 billion Agency purchase program announced earlier this year by President Trump on TruthSocial. Demand for ABS has been robust, with new issuance supported by strong subscription levels from investors. Additionally, risk premiums for the sector remain relatively stable, providing a defensive alternative to credit.
Outlook — Carry On
Market expectations for Fed policy have evolved markedly since the onset of the Iran conflict, shifting from two cuts to almost two hikes projected by the December 2026 FOMC meeting. This reflects a global shift to more hawkish policy stances among many developed market central banks, many of which are shifting their inflation outlooks due to more acute impacts from supply chain disruptions and the spike in energy and other commodity prices. We expect the Fed will continue to take a data-dependent approach to monetary policy during much of the balance of the year as it looks to parse inflation dynamics emanating from global conflict as well as the rapid build out of AI infrastructure. The related capex cycle is presenting a material tailwind for the U.S. economy, but the pace of spend could create bottlenecks in the supply chains. Domestic labor conditions remain delicately balanced and will be a key focus in the back half of the year; any evidence of a material slowdown would likely be met with a swift reassessment for the path of Fed policy — perhaps in opposition to that suggested by current prices.
Financial markets will also be focused on how a reduction in forward guidance from the Fed may impact interest rate volatility as markets adjust to the reduced communication. We believe that uncertainty would be more challenging in a situation in which economic data deteriorated or financial conditions tightened. Much of the increase in forward guidance was borne out of necessity during prior market crises; absent those types of conditions, however, changes in how the Fed communicates are unlikely to have a material impact, in our view.
Expensive valuations are the primary driver of our more defensive-minded posture as of this writing, but we are mindful of the technical backdrop as well. The proliferation of technology-related issuance has impacted quality and spread curves as investor demand occasionally struggles to keep up with the unrelenting supply.
Some of the largest deals this year have come from AA-rated companies, vastly increasing the amount of issuance within the rating category. For much of the post-Great Financial Crisis period, there has been a scarcity of AA-rated debt as only a select few issuers carried that rating profile. That dynamic has narrowed the spread differential of AA- and A-rated credits at the index level, illustrating the impact of prioritizing technicals versus fundamentals during transition periods in markets.
We believe taking a disciplined and well-diversified, yet forward-looking approach to future issuance trends is important in the current environment. Our risk appetite remains modest, given the absolute level of risk spreads. The first half of 2026 produced a “carry plus” environment where risk sector outperformance was driven predominantly by the additional spread or yield from these allocations; we expect a similar profile to prevail for the balance of the year. Our emphasis remains on capturing incremental return, while being mindful of potential volatility that informs return symmetry. We continue to believe these dynamics support higher allocations to up-in-quality structured product and shorter-duration Corporate credit. As ever in fixed income, the starting point matters and while spreads are narrow, the overall yield environment has improved and provides an attractive total return opportunity going forward.
Figure 1. Second Quarter Excess Returns, Bloomberg U.S. Aggregate and U.S. Corporate High Yield Indices
| Category |
Excess Returns Quarter (%) |
Option-adjusted Spread, Quarterly Change (bps) |
| U.S. Credit |
1.11 |
-14 |
| U.S. Credit Industrial |
1.08 |
-12 |
| U.S. Credit Utility |
1.37 |
-14 |
| U.S. Credit Financial Inst. |
1.25 |
-19 |
| MBS |
0.30 |
1 |
| ABS |
0.36 |
-9 |
| U.S. Corporate High Yield |
2.21 |
-47 |
Figure 2. FOMC Dot Plot Evolution
| Date |
Median Projections on 3/18/2026 |
Median Projections on 6/17/2026 |
| 2026 |
3.4% |
3.8% |
| 2027 |
3.1% |
3.6% |
| 2028 |
3.1% |
3.4% |
| Longer Run |
3.1% |
3.1% |
Important Disclosures
Index definitions are available at https://www.pnccapitaladvisors.com/index-definitions/
This publication is for informational purposes only. Information contained herein is believed to be accurate, but has not been verified and cannot be guaranteed. Opinions represented are not intended as an offer or solicitation with respect to the purchase or sale of any security and are subject to change without notice. Statements in this material should not be considered investment advice or a forecast or guarantee of future results. To the extent specific securities are referenced herein, they have been selected on an objective basis to illustrate the views expressed in the commentary. Such references do not include all material information about such securities, including risks, and are not intended to be recommendations to take any action with respect to such securities. The securities identified do not represent all of the securities purchased, sold or recommended and it should not be assumed that any listed securities were or will prove to be profitable. Past performance is no guarantee of future results.
PNC Capital Advisors, LLC claims compliance with the Global Investment Performance Standards (GIPS®). A list of composite descriptions for PNC Capital Advisors, LLC and/or a presentation that complies with the GIPS® standards are available upon request.
PNC Capital Advisors, LLC is a wholly-owned subsidiary of PNC Bank N.A. and an indirect subsidiary of The PNC Financial Services Group, Inc. serving institutional clients. PNC Capital Advisors’ strategies and the investment risks and advisory fees associated with each strategy can be found within Part 2A of the firm’s Form ADV, which is available at https://pnccapitaladvisors.com.
©2026 The PNC Financial Services Group, Inc. All rights reserved.
FOR INSTITUTIONAL USE ONLY
INVESTMENTS: NOT FDIC INSURED-NO BANK GUARANTEE – MAY LOSE VALUE