Clearing the Path Forward
On April 24, the U.S. Department of Justice dropped its criminal probe into Federal Reserve (Fed) Chair Jerome Powell's oversight of and congressional testimony regarding the renovations of the Marriner S. Eccles building, which houses the Fed's main offices. Despite pointed exchanges between Fed chair nominee Kevin Warsh and Democratic lawmakers during his April 21 confirmation hearing, Republican congressional majorities suggest Warsh's likely confirmation, as of this writing. While not assured, a confirmation could support a clean transition ahead of Chair Powell's tenure ending in mid-May, by avoiding the need for Powell to serve as chair pro tempore. At the April 29 Federal Open Market Committee (FOMC) post‑meeting press conference, Powell noted “I've said that I will not leave the Board until this investigation is well and truly over with transparency and finality, and I stand by that.”
Politics aside, we believe Warsh's candidacy offers experience and credibility. Warsh served as a member of the Fed Board of Governors between 2006 and 2011, as well as Special Assistant to the National Economic Council under President George W. Bush's administration. If confirmed, his leadership could come with a change in the Fed's approach to monetary policy, some of which was discussed during the confirmation hearing.
Senate Testimony Provides Context for Incoming Chair Priorities
During his confirmation hearing, Warsh commented that he believed it is “essential (that) monetary policymakers act in the nation's interest” and emphasized his support for Fed independence, stating that he is “committed to ensuring that the conduct of monetary policy remains strictly independent.” Warsh also said that he believed the Fed should “stay in its lane” and avoid issues related to fiscal, social or other policy areas outside of its statutory mandate to support price stability and full employment.
Based on prior comments that he has made, one primary area of focus for Warsh will likely be the Fed's balance sheet, which, in an effort to combat pandemic-related risks to the U.S. economy, peaked at approximately $9 trillion in the first half of 2022. While subsequent quantitative tightening (“QT”) reduced balance sheet holdings by approximately $2 trillion, at $6.7 trillion, the Fed's balance sheet still represents approximately 20% of annual U.S. GDP (Figure 1).
Figure 1. Fed Balance Sheet and Size as Percent of U.S. GDP
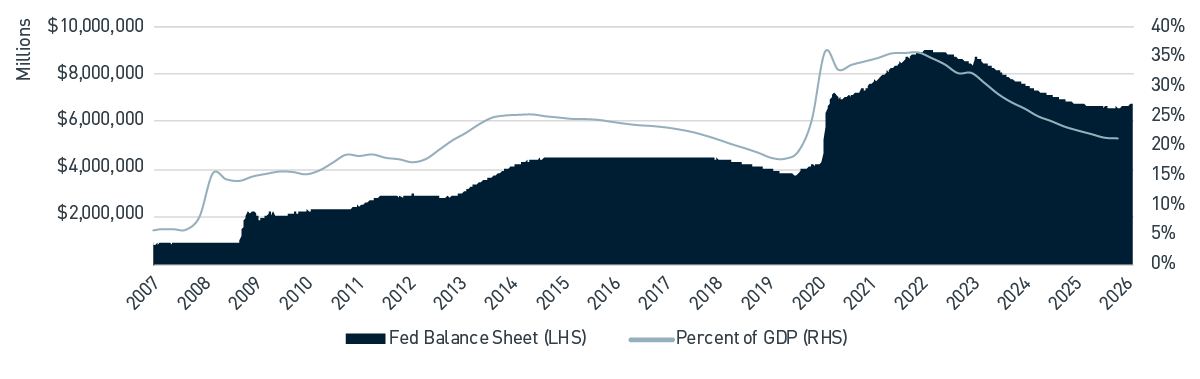
As of 4/22/2026. Source: Bloomberg L.P. View accessible version of chart.
The still sizeable level of balance sheet holdings continues to exert influence on longer-term U.S. Treasury rates, financial conditions and overall market liquidity/risk appetites. We expect Warsh will likely explore ways the Fed can bring its balance sheet down further, albeit to levels well above those which persisted prior to the 2008 financial crisis. Interbank funding needs are a primary consideration in evaluating the appropriate size of the Fed balance sheet. Previous efforts (prior to the COVID-19 global pandemic) produced episodic liquidity shocks in the repo markets, particularly around month and quarter ends (Figure 2).
Figure 2. U.S. Reserves with the Fed vs. DTCC GCF Repo Index®
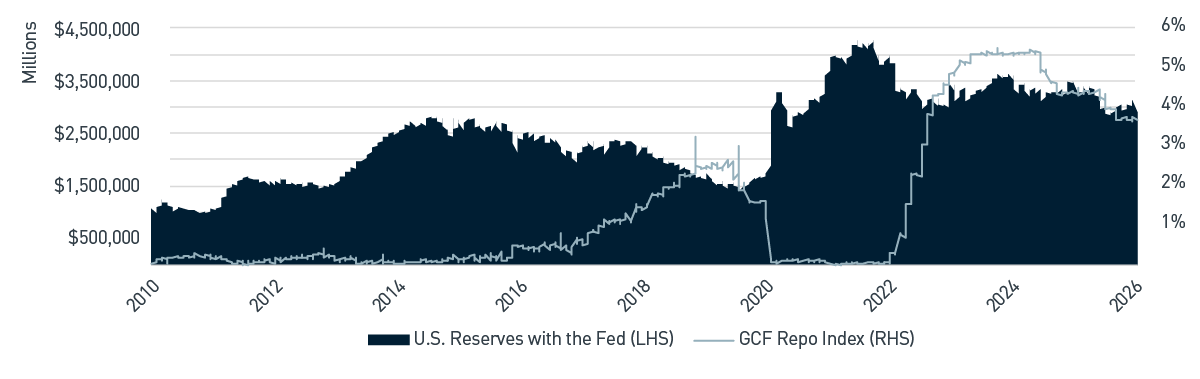
As of 4/22/2026. Source: Bloomberg L.P. View accessible version of chart.
Warsh is also expected to consider changes to more conventional monetary policy tools, including the assessment of inflation trends that influence how the fed funds target rate is set. The Fed currently favors the Core Personal Consumption Expenditures index (Core PCE), which excludes the more volatile food and energy prices. In its quarterly Summary of Economic Projections, FOMC members provide their estimates of key data including Core PCE, and market participants then rely on this forward guidance to assess potential future Fed policy moves.
Warsh has expressed a preference for trimmed mean measures, which act to further smooth changes in inflation. These trimmed inflation measures are currently tracking more closely to the Fed's longer-term 2% objective, despite recent increases in headline and core measures (Figure 3).
Figure 3. Headline Inflation Rates vs. Trimmed Mean Inflation Rates
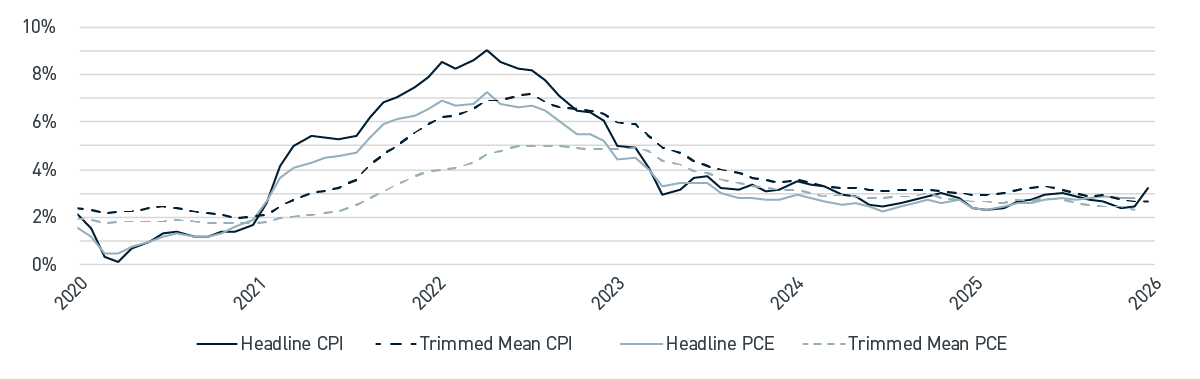
As of 3/31/2026. Source: Bloomberg L.P. View accessible version of chart.
Warsh could also take a forward-looking approach to inflation by considering expected, but unmeasured, effects from factors such as artificial intelligence-driven productivity growth, similar to the technological advances that occurred during Chair Greenspan's tenure in the mid to late 1990s. This could support a more dovish Fed policy bias, despite persistent inflation above the long-run target.
Challenges to the Status Quo
Assuming a timely confirmation, Warsh will chair his first FOMC meeting in mid-June and face significant macroeconomic uncertainty. The global economy is wrestling with considerable near-term inflationary pressures from both higher commodity prices and supply chain disruptions stemming from the Iran conflict, where visibility around a durable resolution remains limited.
At the same time, forecasts for first-quarter U.S. GDP have been moderating, while labor markets remain delicately balanced. After financial conditions tightened around the February 28 outset of the conflict, volatility has since moderated and conditions remain accommodative.
During the first quarter of 2026, FOMC participants shifted to a more balanced assessment of risks to the Fed's dual mandate. Currently, fed funds futures markets imply limited additional policy accommodation through the balance of 2026. Absent a material shock to the labor market, we believe that it will likely be challenging for Warsh to move the consensus towards a more dovish bias in the early stages of his tenure.
Figure 1. Fed Balance Sheet and Size as Percent of U.S. GDP
| Date |
Fed Balance Sheet ($M) |
Percent GPD |
| 2007 |
891,158 |
6 |
| 2010 |
2,420,674 |
16 |
| 2013 |
4,032,640 |
18 |
| 2016 |
4,451,451 |
23 |
| 2019 |
4,165,591 |
19 |
| 2022 |
8,551,169 |
32 |
| 2025 |
6,640,618 |
35 |
Figure 2. U.S. Reserves with the Fed vs. DTCC GCF Repo Index®
| Date |
U.S. Reserves with the Fed ($M) |
GCF Repo Index (%) |
| 2010 |
1,067,938 |
0.19 |
| 2014 |
2,641,132 |
0.06 |
| 2018 |
2,052,590 |
1.76 |
| 2022 |
3,652,982 |
0.28 |
| 2026 |
2901825 |
3.68 |
Figure 3. Headline Inflation Rates vs. Trimmed Mean Inflation Rates
| Date |
Headline CPI |
Trimmed Mean CPI |
Headline PCE |
Trimmed Mean PCE |
| 2020 |
0.32 |
2.15 |
0.46 |
1.73 |
| 2022 |
8.25 |
6.18 |
6.68 |
4.07 |
| 2024 |
3.35 |
3.45 |
2.82 |
3.02 |
| 2026 |
3.25 |
2.34 |
- |
- |
Important Disclosures
Index definitions are available at https://www.pnccapitaladvisors.com/index-definitions/
This publication is for informational purposes only. Information contained herein is believed to be accurate, but has not been verified and cannot be guaranteed. Opinions represented are not intended as an offer or solicitation with respect to the purchase or sale of any security and are subject to change without notice. Statements in this material should not be considered investment advice or a forecast or guarantee of future results. To the extent specific securities are referenced herein, they have been selected on an objective basis to illustrate the views expressed in the commentary. Such references do not include all material information about such securities, including risks, and are not intended to be recommendations to take any action with respect to such securities. The securities identified do not represent all of the securities purchased, sold or recommended and it should not be assumed that any listed securities were or will prove to be profitable. Past performance is no guarantee of future results.
PNC Capital Advisors, LLC claims compliance with the Global Investment Performance Standards (GIPS®). A list of composite descriptions for PNC Capital Advisors, LLC and/or a presentation that complies with the GIPS® standards are available upon request.
PNC Capital Advisors, LLC is a wholly-owned subsidiary of PNC Bank N.A. and an indirect subsidiary of The PNC Financial Services Group, Inc. serving institutional clients. PNC Capital Advisors’ strategies and the investment risks and advisory fees associated with each strategy can be found within Part 2A of the firm’s Form ADV, which is available at https://pnccapitaladvisors.com.
©2026 The PNC Financial Services Group, Inc. All rights reserved.
FOR INSTITUTIONAL USE ONLY
INVESTMENTS: NOT FDIC INSURED-NO BANK GUARANTEE – MAY LOSE VALUE