Second Quarter Highlights
- The U.S. Treasury (UST) curve steepened as yields on shorter-dated bonds fell, reflecting expectations for rate cuts later this year, while longer-dated yields faced upward pressures from fiscal policy-related concerns.
- At its June 18 meeting, the Federal Open Market Committee (FOMC) kept the target fed funds range unchanged at 4.25%-4.50%, prompting growing criticism from the White House.
- The FOMC's Summary of Economic Projections reflected increased expectations for both inflation and the unemployment rate relative to last quarter's projections. The Committee did not adjust the forecast for the fed funds rate for this year, which indicates a cumulative 50 basis points (bps) of rate cuts for the balance of 2025.
- Both hard economic data and sentiment-driven indicators remained volatile during the quarter, reflecting the ongoing uncertainties about how trade policies will ultimately impact the broader economy.
- Following the de-escalation of tariff rhetoric from the White House, volatility across financial markets quickly subsided from the elevated levels seen early in the second quarter.
- Risk premiums compressed, fully recovering from their selloff in March and April. This led valuations for both investment grade and high yield sectors to revisit their post-Great Financial Crisis lows.
Duration Positioning
Neutral
Remaining neutral on duration positioning given balanced yield and return symmetry.
Credit Sector
Underweight
Expensive valuations support maintaining an underweight allocation to credit. Within sub-sectors, strategies are overweight banking and energy, while underweight capital goods, insurance and non-corporate credit.
Structured Products
Overweight
Allocations in asset-backed securities (ABS) have been moderated across strategies but remain overweight relative to benchmarks. Allocations in agency mortgage-backed securities (MBS) remain overweight within both Aggregate and Non-aggregate styles.
The Market's Second-quarter Roller Coaster Ride
The tariffs announced by the White House in early April sent shockwaves through global financial markets as the magnitude of the trade policy details were far more severe than investors had anticipated. After several days of market consternation, the White House announced a pause on implementation in order to provide time for trade partners to negotiate better terms. While brief, volatility was pronounced as both risk-assets and “risk-free” UST securities came under intense selling pressure. As the quarter continued, markets generally managed to look past trade policy uncertainties as well as a bevy of disconcerting geopolitical events. In fact, by the end of the second quarter, credit spreads had largely recovered, and equity markets breached all-time highs.
Despite ongoing concerns about resurgent inflation and fiscal profligacy, the Bloomberg U.S. Aggregate Bond Index returned 1.21% for the quarter, bringing the return for the first half of 2025 to a respectable 4.02%. The UST yield curve steepened throughout the quarter; short to intermediate maturities declined by approximately 15 bps, while longer-dated maturities increased by 20 bps. Risk premiums quickly recovered from the early April selloff; investment grade spreads compressed 10 bps over the quarter to an option-adjusted spread (OAS) of 79 bps. This resulted in excess returns for credit of 100 bps, which was even more impressive considering that year-to-date excess returns for credit as of April 8th were a negative 210bps (Figure 1). Returns for structured products were positive as well; excess returns for ABS and MBS were 27 bps and 17 bps, respectively. Given the risk-on tone, high yield outperformed investment grade with positive excess returns of 2.17%.
Figure 1. Rolling Excess Returns (%)
A Fiscal Policy High Stakes Gamble?
The multiple extensions that followed the initial April 2 tariff announcements have led many investors to assume that ultimately, trade policy will not have nearly as harsh an impact as the initial rhetoric. While as of this writing, substantive trade deals have remained elusive and tariff threats continue, recent market reactions have been muted, driving volatility lower. Uncertainty around the end state of tariff policies has contributed to fatigue among investors but risks remain that renewed tensions could once again spike volatility. With the passage of the budget bill and the revised tariff deadline of August 1 looming, we would not be surprised to see headline risk begin to gather increased market attention in the coming weeks.
Two trends that have remained consistent thus far this year have been the steepening of the UST yield curve and the weakening of the U.S dollar. Pressure has developed from a combination of trade policy uncertainty, expectations for rising government debt and an evolving foreign policy stance. With expanded tax cuts in the budget bill, the U.S fiscal trajectory is projected to become more unsustainable. The Congressional Budget Office estimates an incremental $3.4 trillion deficit impact over the next 10 years, with interest expenditures approaching $2 trillion annually.
Prior to the legislation's passage, Moody's Ratings stripped the United States of its last AAA-rating, joining Standard & Poor's and Fitch Ratings at the equivalent of high double-A. As highlighted in our recent publication, The Last Straw, Moody's cited rising debt levels and interest servicing costs, along with long-term pressures from entitlement programs as some of the most pressing factors influencing their decision. While the rating cut was well telegraphed, it did coincide with a jump in 30-year bond yields back to more than 5%, which was the highest level since November 2023 (coincidentally, when Moody's first assigned a negative outlook to the U.S.).
As fiscal concerns have been a recurring theme over the last several years, longer-dated USTs are incorporating a higher term premium, arising from both fiscal policy supply-related concerns and elevated inflation. Shorter-dated maturities, which are more heavily influenced by expectations for the fed funds rate, have been more anchored to expectations for additional rate cuts before year end, resulting in a steepening of the curve (Figure 2).
Figure 2. 5-year UST / 30-year UST Yield Curve (bps)

As of 6/30/2025. Source: Bloomberg L.P. View accessible version of chart.
Monetary Policy — Pressure's On
It remains difficult to gauge how fiscal, immigration and trade policies will impact the U.S. economy, leaving the Federal Reserve (Fed) in wait-and-see mode. The Fed's policy statement from the June 18 FOMC meeting struck a balanced tone as the policy rate was kept unchanged. The FOMC is attentive to risks on both sides of the dual mandate (maximum employment and price stability), but did acknowledge that uncertainty around the economic outlook had diminished.
While meaningful inflation progress continued in the quarter, some FOMC members remain concerned about future inflation as evidenced by the increased projections in the Summary of Economic Projections. The median core Personal Consumption Expenditures estimate rose by 30 bps to 3.1% in 2025. Additionally, longer-term projections crept higher for 2026 and 2027.
Concerns around softening in the labor market have been a recurring theme in recent months, but the headline numbers from the June payroll report alleviated some concerns. The better-than-expected job gains of 147,000, along with a drop in the unemployment rate to 4.1%, helped to support the Fed's patient policy posture. However, underlying trends might not be as strong; private payrolls were somewhat sluggish and the lower unemployment rate was aided by a drop in the labor force participation rate, partially driven by a decline in non-U.S.-born workers. We believe the evolution of trends in the labor market will have a key influence on the Fed's conviction as it considers further calibration of the policy rate.
While encouraged by recent trends in inflation, the FOMC remains cautious as it evaluates the implications of trade and tariff policies. With little evidence yet of inflationary pressures from these policies, recent comments from Fed policymakers suggest a range of opinions regarding the magnitude, timing and persistency of these impacts. The Fed's “dot plot” illustrates the stark divide among the Committee as most members either expect no change in policy, or 50 bps of cumulative cuts by the end of 2025. While Fed Chair Jerome Powell's term is not slated to end until May 2026, successor talk has been rampant as has criticism of current monetary policy. We believe these efforts can complicate the Committee's ability to execute its dual mandate and that efforts to oust Powell from his role could lead to increased volatility.
Continued policy uncertainty has impacted broader economic data, as evidenced by the -0.5% drop in first-quarter U.S. GDP, which was materially skewed by a surge in imports. If trade factors were excluded however, GDP would have been solidly positive. We expect these distortions to be less impactful in the second quarter, with most forecasts for GDP in the 2-3% range. As has been the case for some time, most of the growth in GDP is being driven by a resilient consumer, who, despite indicating less confidence in economic surveys, has continued to spend at a healthy clip. That said, manufacturing indicators remain sluggish and will likely continue to face headwinds until greater clarity on trade is achieved, in our view.
Portfolio Positioning & Outlook — Scaling the Wall of Worry
Given the rapid recovery in credit spreads and the highly uncertain outlook, we are maintaining defensive postures in portfolios with a modestly underweight allocation to credit. In our view, valuations are quite expensive on a historical basis and offer little opportunity for meaningful spread compression from current levels. Year-to-date credit spreads have been virtually unchanged, and excess returns have tracked carry (yield advantage) of the sector. As shown in Figure 3, accruing that return has been challenged by the volatility of spreads during the drawdown after April 2. While market technicals are likely to remain favorable as new issue supply is set to wane in the summer months, the symmetry of potential outcomes for risk premiums is no longer attractive. Within corporate credit, we remain favorable on the Banking and Energy sectors, which we expect to benefit from a more favorable regulatory environment.
Figure 3. Bloomberg U.S. Credit Index vs. Bloomberg U.S. Credit 1-3-year Index Average Option-adjusted Spread (bps)
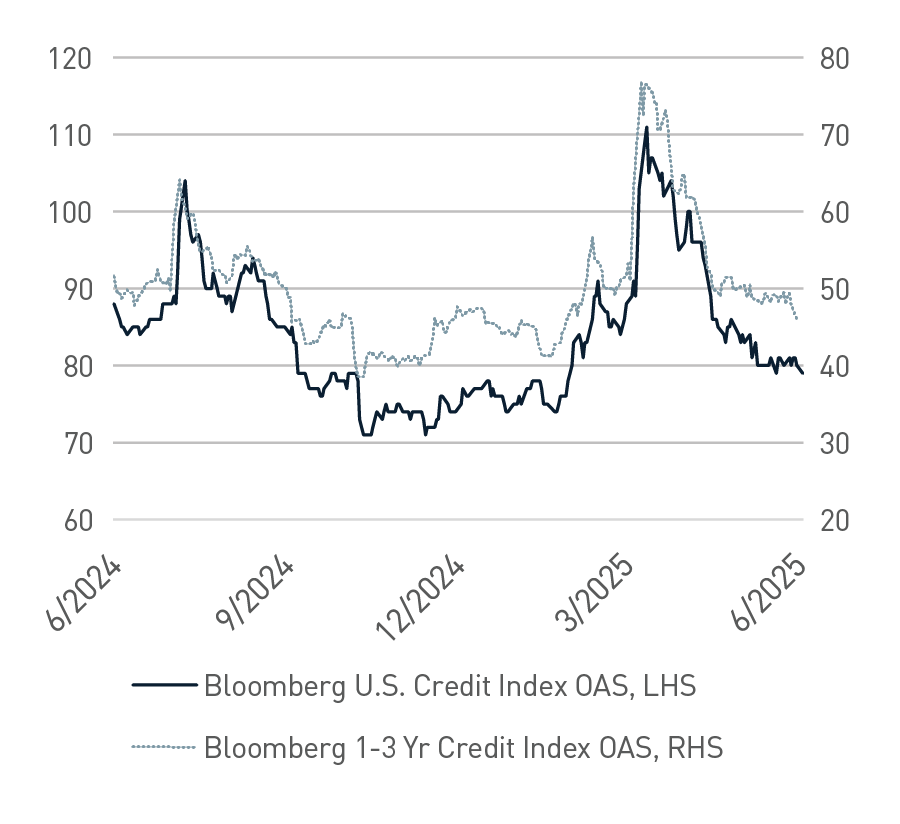
As of 6/30/2025. Source: Bloomberg L.P. View accessible version of chart.
We also expect second-quarter corporate earnings season to provide further clarity on the impact of tariff policies as companies will now have had a full quarter to react to the evolving trade disruptions. The Manufacturing sector will be especially telling, in our view, and particularly informative to understand inventory replenishment, given the tariff front-running that occurred earlier this year. Additionally, staffing plans will be closely monitored by analysts as the overall hiring rate remains anemic and recent layoff announcements have garnered increased attention. Lastly, many investors will be searching for signs of margin pressures, stemming from an inability to pass through price increases.
Within structured securities, we remain favorably inclined on agency-MBS, in which valuations remain attractive relative to historical averages. The market is supported by favorable prepayment fundamentals and should stand to benefit if the level and volatility of rates remain range bound. Additionally, regulatory reform impacting bank capital requirements may eventually increase the demand for MBS, providing a positive technical. Within the ABS sector, we continue to maintain overweight allocations but have pared back exposure slightly given less-compelling valuations. Recent demand for new deals has been significantly oversubscribed, impacting pricing and the availability of acquiring bonds in secondary markets.
Markets are easing into the summer doldrums with a healthy dose of complacency, as they are exhibiting less beta to headlines about escalating trade and tariffs tension than they had in the spring. Meanwhile, from a macro backdrop perspective, geopolitical conflicts in both Eastern Europe and the Middle East persist. In the U.S., the economy continues to perform admirably, but it is difficult to discern clear trends given shifting fiscal policies.
With an underweight across much of the Credit sector, we continue to lean into our overweight positions in higher-quality Structured Products and focus on a more defensive portfolio structure. This is designed to enable us to take advantage of opportunities should volatility re-emerge, and spreads adjust accordingly.
Figure 1. Rolling Excess Returns (%)
| Category |
As of 3/31/2025 |
As of 4/8/2025 |
As of 6/30/2025 |
| U.S. Credit |
-0.76 |
-2.10 |
0.26 |
| U.S. Credit Industrial |
-0.94 |
-2.55 |
0.12 |
| U.S. Credit Utility |
-1.54 |
-2.67 |
-0.34 |
| U.S. Credit Financial Inst. |
-0.52 |
-1.86 |
0.50 |
| MBS |
-0.07 |
-0.73 |
0.10 |
| ABS |
-0.29 |
-0.37 |
-0.02 |
| U.S. Corporate High Yield |
-1.13 |
-4.18 |
1.04 |
Figure 2. 5-year UST / 30-year UST Yield Curve (bps)
| Date |
5s/30s |
| 1/31/2025 |
4.78 |
| 2/28/2025 |
4.48 |
| 3/31/2025 |
4.57 |
| 4/30/2025 |
4.67 |
| 5/30/2025 |
4.93 |
| 6/30/2025 |
4.77 |
Figure 3. Bloomberg U.S. Credit Index vs. Bloomberg U.S. Credit 1-3-year Index Average Option-adjusted Spread (bps)
| Date |
Bloomberg U.S. Credit Index OAS |
Bloomberg 1-3 Yr Credit Index OAS |
| 6/30/2024 |
79 |
49.33 |
| 9/30/2024 |
89 |
42.82 |
| 12/31/2024 |
77 |
46.91 |
| 3/31/2025 |
84 |
56.53 |
| 6/30/2025 |
88 |
46.06 |
Important Disclosures
Index definitions are available at https://www.pnccapitaladvisors.com/index-definitions/
This publication is for informational purposes only. Information contained herein is believed to be accurate, but has not been verified and cannot be guaranteed. Opinions represented are not intended as an offer or solicitation with respect to the purchase or sale of any security and are subject to change without notice. Statements in this material should not be considered investment advice or a forecast or guarantee of future results. To the extent specific securities are referenced herein, they have been selected on an objective basis to illustrate the views expressed in the commentary. Such references do not include all material information about such securities, including risks, and are not intended to be recommendations to take any action with respect to such securities. The securities identified do not represent all of the securities purchased, sold or recommended and it should not be assumed that any listed securities were or will prove to be profitable. Past performance is no guarantee of future results.
PNC Capital Advisors, LLC claims compliance with the Global Investment Performance Standards (GIPS®). A list of composite descriptions for PNC Capital Advisors, LLC and/or a presentation that complies with the GIPS® standards are available upon request.
PNC Capital Advisors, LLC is a wholly-owned subsidiary of PNC Bank N.A. and an indirect subsidiary of The PNC Financial Services Group, Inc. serving institutional clients. PNC Capital Advisors’ strategies and the investment risks and advisory fees associated with each strategy can be found within Part 2A of the firm’s Form ADV, which is available at https://pnccapitaladvisors.com.
©2025 The PNC Financial Services Group, Inc. All rights reserved.
FOR INSTITUTIONAL USE ONLY
INVESTMENTS: NOT FDIC INSURED-NO BANK GUARANTEE – MAY LOSE VALUE