Fourth Quarter Highlights
- The Federal Open Market Committee (FOMC) cut rates by 25 basis points (bps) at both the October and December meetings, bringing the target range for the federal funds rate to 3.50%-3.75%.
- Both FOMC meetings this quarter had multiple dissents to the policy decision, with the December meeting featuring two committee members who favored no change in policy, while another committee member preferred a 50-bp cut.
- The lengthy government shutdown, which lasted from October 1 through November 12, resulted in delayed economic data releases that clouded financial market participants', and the Federal Reserve (Fed)'s, ability to assess economic conditions.
- Calendar year 2025 ended as the second-most active year in corporate new issue supply, partially driven by several large fourth-quarter bond sales from major technology companies seeking to finance artificial intelligence (AI)-related infrastructure projects.
- Investment grade credit spreads moved modestly higher in the quarter but remain near historically low levels.
- U.S. agency mortgage-backed securities (MBS) experienced strong excess returns for both the fourth quarter and the full calendar year, aided by declining interest rate volatility.
Duration Positioning
Neutral
Remain neutral on duration positioning given balanced yield and return symmetry.
Credit Sector
Underweight
Expensive valuations support maintaining an underweight allocation to credit. Within sub-sectors, strategies are overweight banking and energy, while underweight capital goods, insurance and non-corporate credit.
Structured Products
Overweight
Allocations in asset-backed securities (ABS) have been moderated across strategies but remain overweight relative to benchmarks. Allocations in MBS remain overweight within both aggregate and non-aggregate styles.
Fourth Quarter Market Summary
Fixed income markets were relatively calm during the fourth quarter as interest rate volatility moderated to multiyear lows, and risk premiums were generally stable. Most tier-one economic data, i.e., GDP report, inflation reports, etc. was delayed due to the lengthy government shutdown, and expectations for additional monetary policy accommodation and relatively loose financial conditions kept financial markets relatively sanguine. As widely expected, the FOMC proceeded with an additional 50 bps of rate cuts during the quarter as the Committee sought to move the fed funds rate to a less restrictive stance. The cuts were supported by the softening in labor markets that had persisted for much of the second half of the year, and which was punctuated by the annual revisions to the U.S. Bureau of Labor's employment statistics in early September.
The Bloomberg U.S. Aggregate Bond Index returned 1.10% for the quarter, bringing the year-to-date total return to 7.30% and marking the strongest yearly return since 2020. Shorter-dated U.S. Treasury (UST) yields fell in conjunction with Fed cuts, while longer-dated UST yields rose modestly, resulting in a steeper yield curve. Investment grade credit spreads increased by 3 bps, leaving the Bloomberg Credit Index's option-adjusted spread (OAS) at 73 bps to end the year (Figure 1). This resulted in 2 bps of negative excess returns for credit during the quarter, while full-year excess returns were 1.26%. The MBS sector continued its recent trend of strong relative performance, with excess returns for the quarter and year of 69 bps and 1.71%, respectively.
Figure 1. Fourth-quarter Sector Excess Returns and Option-adjusted Spreads
Excess returns were broadly positive, with MBS and high yield as the largest outperformers
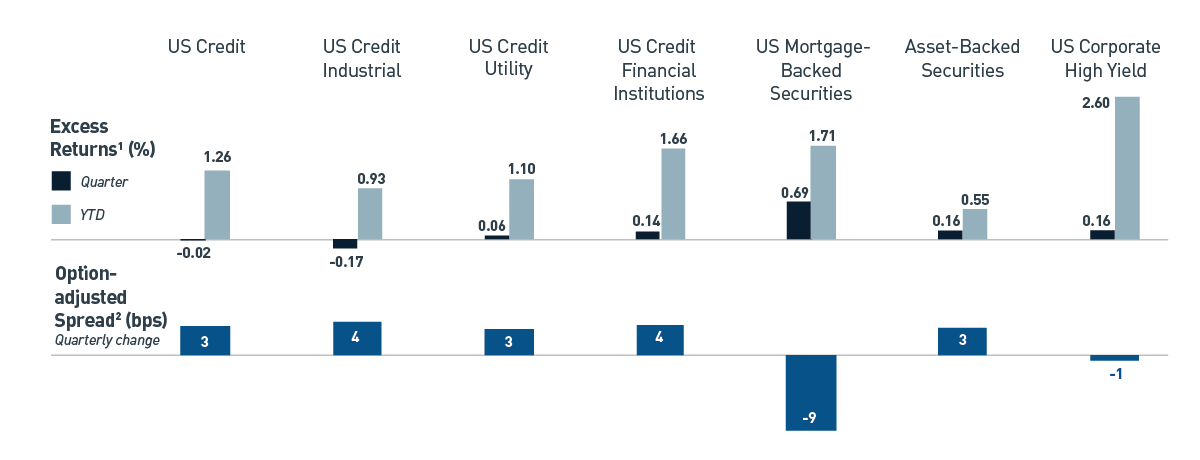
As of 12/31/2025. Source: Bloomberg L.P. View accessible version of chart.
1 Excess total return of each index/component of the index relative to the duration-matched UST Index.
2 Of the Bloomberg U.S. Aggregate Index.
Monetary Policy — Dissents & Drama
Although inflation remains stubbornly above the 2% target, apprehensions about a possible increase in inflation due to tariffs have diminished. Concurrently, continued signs of labor market weakness have led the Fed to give increased priority to this aspect of its dual mandate (Figure 2). Following the December meeting, Chair Jerome Powell noted that after a cumulative 75 bps in cuts in 2025, the Committee was now well positioned to see how the economy evolves as the lagged effects of policy easing take effect. Additionally, he stressed that monetary policy was now within a range of what is to be considered generally neutral. The Committee's latest Summary of Economic Projections (SEP) reinforces these expectations with just one forecasted cut in each of 2026 and 2027 — albeit with a broad range of forecasts among participants.
Figure 2. Nonfarm Payrolls: Month-over-Month Net Change
Nonfarm payrolls trending lower
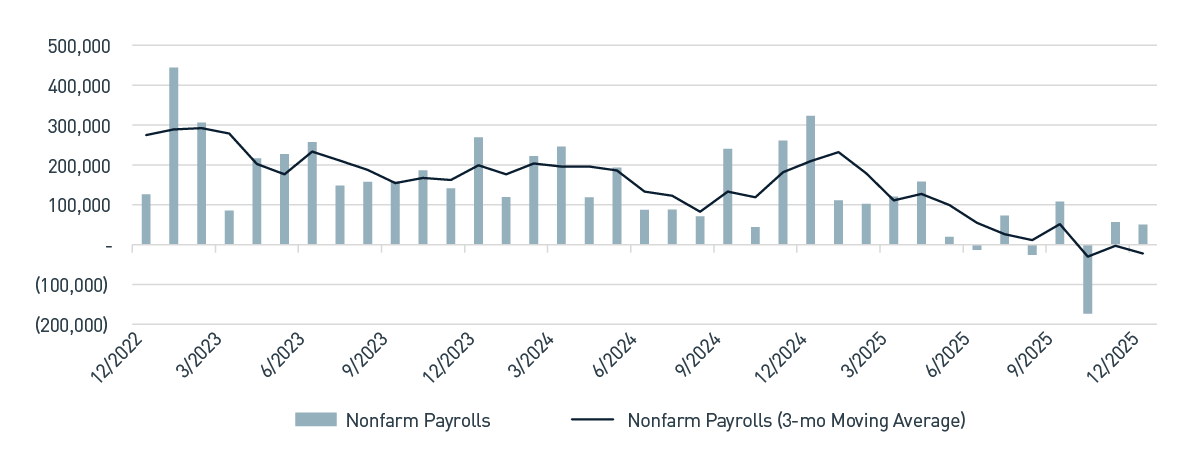
As of 12/31/2025. Source: Bloomberg L.P. View accessible version of chart.
The decision to cut rates by 25 bps in December was not a consensus decision as there were three formal dissents — two policymakers preferred no cut, and one favored a 50-bps cut. Additionally, the quarterly rate forecasts in the SEP illustrated that six policymakers preferred rates to remain unchanged (i.e., ‹silent dissents'). Chair Powell characterized these differing perspectives as understandable considering the varied economic indicators that signal potential pressures to both employment and inflation.
Although he may continue serving on the Fed's Board of Governors, Chair Powell's term leading the FOMC concludes in May 2026. Additional changes to the Board's composition include four new Federal Reserve Bank Presidents that will rotate into the FOMC as voting members, as well as pending litigation to remove Governor Lisa Cook for cause. The White House continues to criticize Fed policy as being too restrictive, suggesting the President's forthcoming nominee to succeed Powell will likely bring a more dovish perspective. Overall, achieving consensus within the FOMC may prove more challenging in the absence of clear direction from economic data.
Political pressure on the Fed has been an ongoing concern for the market for much of the past year but was recently amplified with the announcement that the Department of Justice was initiating a criminal investigation related to building renovations. Immediate bipartisan criticism of the subpoena helped to lessen the market reaction, however the ongoing challenges to the Fed's independence do raise investor concerns.
Portfolio Positioning — Seems Like We've Been Here Before
Historically expensive valuations in corporate credit continue to be the primary driver of defensive portfolio positioning across strategies. Credit spreads remained very resilient during the fourth quarter, with new issuance easily absorbed by yield-hungry investors. Several large deals by high-quality technology companies provided opportunities for us to add exposure at attractive concessions as long duration spreads across high-quality sectors widened.
Credit fundamentals continue to be strong as corporate balance sheets remain in solid shape across most industries. However, ambitious capital spending initiatives aimed at AI-related infrastructure projects and an increase in acquisition activity given the friendly regulatory environment, increase the odds of an uptick in leverage. In fact, current expectations are for 2026 to be a record-setting year of investment grade issuance, and one likely to exceed the torrid pace of 2020.
The MBS sector finished the year strong, with 171 bps of excess returns, representing the best year since 2010. Stable prepayments, manageable new supply, low-interest rate volatility and compelling valuations have provided a steady tailwind for the sector. Real money demand continues to be robust, both Fannie Mae and Freddie Mac have been increasing their purchases, helping to offset the Fed's ongoing balance sheet reduction. This is anticipated to accelerate with the recent White House proposal for government-sponsored enterprises to purchase an additional $200 billion to support home affordability. MBS securities experienced a significant rally following the announcement, as this extra technical support is anticipated to further strengthen the sector.
Even with the strong run in MBS, we continue to view the sector positively and have maintained overweight allocations across strategies. While valuations are now best characterized as modestly attractive, they remain more compelling than credit, which we view as priced to perfection.
The symmetry of potential return outcomes is also informed by our concerns related to recent political proposals that could negatively impact various industries — recent initiatives to improve affordability have targeted the banking, energy and housing sectors and, if enacted, could impact profitability.
Outlook — A Long, Strange Trip It Might Be
Entering 2026, risk valuations once again leave few obvious opportunities for outperformance and inform more defensive positioning across strategies. Our focus remains on delivering strong relative performance with less volatility than benchmarks; we believe this continues to support overweight positioning across both high-quality structured products and short-duration corporate credit. This type of positioning can help produce a modest yield/total return advantage for the strategies and affords dry powder should episodic volatility flare again over the course of the year. From a total return perspective, broad U.S. bond indices are set up for another potentially strong performance year, with the yield on the Bloomberg U.S. Aggregate Index approximately 4.3%, nearly 60 bps lower than a year ago.
Our outlook is anchored by a challenging macro environment. While domestic growth will likely be supported by accommodative fiscal and monetary policies, pressures continue to grow along several fault lines. Principally, we are concerned about ongoing challenges to the Fed's independence. Chair Powell's video release and press conference in early January were unprecedented and illustrates the risks associated with the Administration's desire to run the economy “hot.” Financial conditions are loose, and the Fed's real policy rate is now around 1%; should the inflation outlook continue to improve, the Fed has some flexibility to further calibrate the policy rate. Additionally, the contested selection process for the next Fed Chair will certainly be a closely followed development by many investors.
Plenty of themes have the potential to influence financial markets in 2026, each bringing a wide range of possible outcomes. Fiscal profligacy and stubborn inflation could easily result in another spike in term premia, which has been a repeated source of volatility over the last several years. Additionally, with pressure growing on the affordability narrative, recently announced policy initiatives have focused on the housing market and debt service costs. That said, the geopolitical landscape continues to evolve, with broadening risks from an escalation of tensions in the Middle East, Latin America and Europe. As the macro backdrop keeps “Throwing Stones”, Weir see if fixed income markets can just keep “Truckin'” and maintain their resiliency.
Figure 1. Fourth-quarter Sector Excess Returns and Option-adjusted Spreads
| Category |
Excess Returns Quarter (%) |
Excess Returns YTD (%) |
Option-adjusted Spread, Quarterly Change (bps) |
| U.S. Credit |
-0.02 |
1.26 |
3 |
| U.S. Credit Industrial |
-0.17 |
0.93 |
4 |
| U.S. Credit Utility |
0.06 |
1.10 |
3 |
| U.S. Credit Financial Inst. |
0.14 |
1.66 |
4 |
| MBS |
0.69 |
1.71 |
-9 |
| ABS |
0.16 |
0.55 |
3 |
| U.S. Corporate High Yield |
0.16 |
2.60 |
-1 |
Figure 2. Non-farm Payrolls: Month-over-Month Net Change
| Date |
Nonfarm Payrolls |
Nonfarm Payrolls 3-Mo Moving Avg. |
| 12/2022 |
126,000 |
274,333 |
| 12/2023 |
269,000 |
198,667 |
| 12/2024 |
323,000 |
209,333 |
| 12/2025 |
50,000 |
(22,333) |
Important Disclosures
Index definitions are available at https://www.pnccapitaladvisors.com/index-definitions/
This publication is for informational purposes only. Information contained herein is believed to be accurate, but has not been verified and cannot be guaranteed. Opinions represented are not intended as an offer or solicitation with respect to the purchase or sale of any security and are subject to change without notice. Statements in this material should not be considered investment advice or a forecast or guarantee of future results. To the extent specific securities are referenced herein, they have been selected on an objective basis to illustrate the views expressed in the commentary. Such references do not include all material information about such securities, including risks, and are not intended to be recommendations to take any action with respect to such securities. The securities identified do not represent all of the securities purchased, sold or recommended and it should not be assumed that any listed securities were or will prove to be profitable. Past performance is no guarantee of future results.
PNC Capital Advisors, LLC claims compliance with the Global Investment Performance Standards (GIPS®). A list of composite descriptions for PNC Capital Advisors, LLC and/or a presentation that complies with the GIPS® standards are available upon request.
PNC Capital Advisors, LLC is a wholly-owned subsidiary of PNC Bank N.A. and an indirect subsidiary of The PNC Financial Services Group, Inc. serving institutional clients. PNC Capital Advisors’ strategies and the investment risks and advisory fees associated with each strategy can be found within Part 2A of the firm’s Form ADV, which is available at https://pnccapitaladvisors.com.
©2026 The PNC Financial Services Group, Inc. All rights reserved.
FOR INSTITUTIONAL USE ONLY
INVESTMENTS: NOT FDIC INSURED-NO BANK GUARANTEE – MAY LOSE VALUE