Third Quarter Highlights
- U.S. Treasury (UST) yields fell during the third quarter, primarily due to a series of weaker-than-anticipated labor market data releases.
- Highlighting downside risks to employment, the Federal Open Market Committee (FOMC) lowered the target range for the fed funds rate to 4.00%-4.25% at its September 17 meeting.
- Acknowledging further risks to labor markets, the FOMC's Summary of Economic Projections indicated a cumulative 50 basis points (bps) of additional rate cuts to come in the fourth quarter of 2025. However, forecasts also suggested that inflation would remain above the Federal Reserve (Fed)'s 2% policy target through 2026.
- Broader economic data was generally positive as strong consumer spending and robust business investment indicated that the economy remains resilient and on a positive trajectory.
- Measures of volatility across financial markets subsided despite continued uncertainty related to trade policies.
- Solid economic fundamentals and expectations for easier monetary policy helped credit spreads further compress in the third quarter, pushing risk premiums to multidecade lows.
- U.S. agency mortgage-backed securities (MBS) had a strong quarter, aided by declining interest rate volatility and stable fundamentals.
Duration Positioning
Neutral
Remain neutral on duration positioning given balanced yield and return symmetry.
Credit Sector
Underweight
Expensive valuations support maintaining an underweight allocation to credit. Within sub-sectors, strategies are overweight banking and energy, while underweight capital goods, insurance and non-corporate credit.
Structured Products
Overweight
Allocations in asset-backed securities (ABS) have been moderated across strategies but remain overweight relative to benchmarks. Allocations in MBS remain overweight within both aggregate and non-aggregate styles.
Third-quarter Return Summary
Over the past several months, financial markets have experienced positive momentum due to above-trend economic growth and expectations for more accommodative future monetary policy. Elevated levels of consumer spending and increased business investment have accelerated economic activity to its strongest rate in nearly two years. Meanwhile, deteriorating labor market trends have resulted in an increasingly dovish stance from the FOMC. This confluence of factors fostered an environment in which both UST yields and risk premiums moved lower during the third quarter, resulting in strong returns for fixed income investors.
The Bloomberg U.S. Aggregate Bond Index returned 2.03% for the quarter, bringing the year-to-date return to an impressive 6.13%. In conjunction with the September fed funds rate cut, shorter-dated UST yields fell more substantially than longer-dated maturities and resulted in a steeper yield curve.
Investment grade credit spreads tightened by 9 bps during the quarter, leaving the Bloomberg U.S. Credit Index option-adjusted spread at just 70 bps. This resulted in excess returns for the credit sector of 97 bps for the quarter, and 1.27% for the full year (Figure 1). The MBS sector enjoyed a particularly strong quarter with 83 bps in excess return, while the ABS sector generated 39 bps in excess return.
Figure 1. Third-quarter Sector Excess Returns and Option-adjusted Spreads
Excess returns were broadly positive, with investment grade utilities and high yield as the largest outperformers
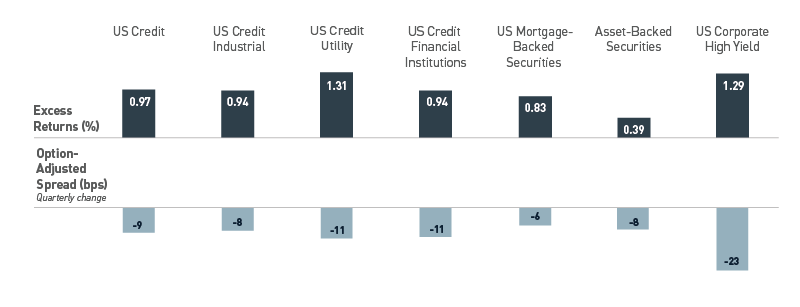
As of 9/30/2025. Source: Bloomberg L.P. View accessible version of chart.
Monetary Policy — Poor Visibility on the Path to Neutral
The Fed's job has become increasingly more complicated as a weakening labor market coincides with rising inflationary pressures. Payroll reports for July and August were lower than anticipated, with notable downward adjustments made to data from previous months. Furthermore, the preliminary estimate of the benchmark revisions from the Bureau of Labor Statistics indicated 911,000 fewer jobs were created than previously reported between April 2024 and March 2025. Alternative private and survey-based sources suggest the labor market is showing signs of softening and may not have been as strong as previously estimated during much of the past year. Meanwhile, core inflation measures have drifted higher and now stand approximately a full percentage point above the Fed's desired 2% policy objective. The services sector remains the primary driver of inflation as thus far, tariffs have not materially impacted goods inflation as much as originally feared.
Approaching the September FOMC meeting, Fed officials generally recognized that employment risks outweighed inflation concerns, thereby preparing the market for a widely expected 25-basis-point reduction in the fed funds rate. The meeting's statement directly cited the combination of slower job growth and a higher unemployment rate as the primary rationale for the cut. During September's press conference, Fed Chair Jerome Powell characterized the policy decision as a risk management exercise to help stem employment weakness.
The Summary of Economic Projections showed inflation is expected to stay above the 2% target through 2025 and 2026, with only a slight increase in unemployment. The Fed cut its forecast for the fed funds rate by another 25 bps for this year and next, signaling 50 bps of additional cuts in 2025 and 25 bps in 2026. Market pricing matches the Fed's 2025 projections but anticipates much lower rates in 2026, indicating expectations for more aggressive easing.
Politics continue to complicate the Fed's predicament as the current government shutdown is resulting in a multitude of economic data releases being delayed until Congress can resolve the current impasse. Additionally, political pressure remains elevated with the President frequently criticizing the current policy stance and seeking to remove a Fed Governor, shortly after having added a Fed Governor of his choosing. Markets have reacted by exhibiting some concern over Fed independence but have largely looked past the rhetoric to date.
Portfolio Positioning — Lower Volatility Bias
Defensive portfolio positioning remains primarily influenced by expensive valuations across credit markets. Credit spreads have tightened to multidecade lows, offering limited opportunities for further compression and excess returns. While fundamentals remain generally stable, there have been some isolated bankruptcies that indicate growing stress among lower-quality issuers that warrants attention. Shareholder-friendly activity is also picking up with the recent announcement of the largest leveraged buyout in history, along with an uptick in merger and acquisition-related activity. Given the significant easing of financial conditions and a lenient regulatory environment, this type of activity is likely to persist, in our view.
New issuance activity has remained strong throughout the year, accelerating notably in September, which recorded the fifth highest monthly supply on record (Figure 2). Investor demand continues to underpin the primary market, as yields remain compelling relative to historical norms, even with the recent decline in interest rates. As of late, new issue markets have been one of the primary areas in which we have sought to reposition portfolios. In an environment with narrow credit spreads, opportunities remain limited, but we have been able to execute extension trades among higher conviction issuers. Similarly, in September the active new issue calendar presented opportunities for modest relative value swaps.
Figure 2. Top Monthly New Investment Grade Corporate Bond Issuance Volumes
Excluding the pandemic-era, September marked the second busiest month in history
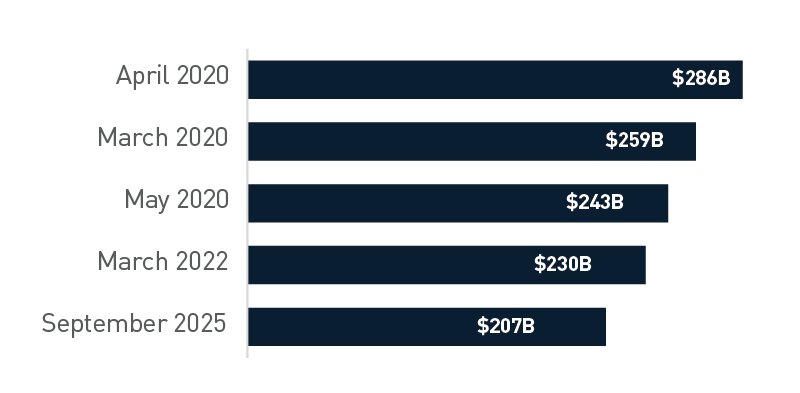
As of 9/30/2025. Source: Bloomberg L.P. View accessible version of chart.
In our view, better opportunities exist in the securitized sectors. Despite the recent strong run for MBS, valuations remain reasonable, providing a high-quality alternative to credit. Fundamentals have been aided by a reduction in interest rate volatility, limited supply and a steepening yield curve. A significant wave of refinancing is unlikely, as yield curve dynamics have largely protected the mortgage market, with only higher coupon segments susceptible to an acceleration in prepayments. We expect to maintain overweight positions across strategies, ensuring that our holdings are broadly diversified across the coupon stack, with limited exposure to extreme coupons at either end of the spectrum.
Outlook — Markets at Cruising Altitude; Watch for Air Pockets
Heading into the fourth quarter, loose financial conditions and frothy risk asset valuations prevail. With a real policy rate currently near 1%, we believe the Fed faces near-term constraints in providing additional easing without fostering additional risk-taking. The near-term outlook for inflation remains challenged by both domestic demand factors as well as global trade. We lack clarity on policy, especially in ongoing negotiations between the United States (U.S.) and China, where rhetoric has recently sparked renewed volatility. Litigation of the administration's tariff policy is working its way through the courts and continued uncertainty is a headwind for the broader economy. Importantly, monthly tariff revenue of roughly $30 billion has helped to counter sizeable fiscal deficits that were worsened with this summer's budget bill; revenue offsets were a factor cited by Standard & Poor's as a positive consideration in affirming their AA+ rating of the U.S. in August.
With stretched valuations across most fixed income sectors, our emphasis remains on maintaining a defensive portfolio structure focused on short-duration credit and structured products. Recently, lower rate volatility and a steepening yield curve provided a tailwind for agency MBS, which constitutes our primary portfolio overweight across most strategies. Year to date, MBS has delivered a similar excess return profile to credit with approximately half of the trailing volatility (Figure 3). With a complicated and highly uncertain outlook, we continue to focus on offering our clients a “smoother ride” as we anticipate ongoing bouts of volatility going forward.
Figure 3. Year-to-date Excess Return*
MBS has delivered a similar excess return profile to Credit
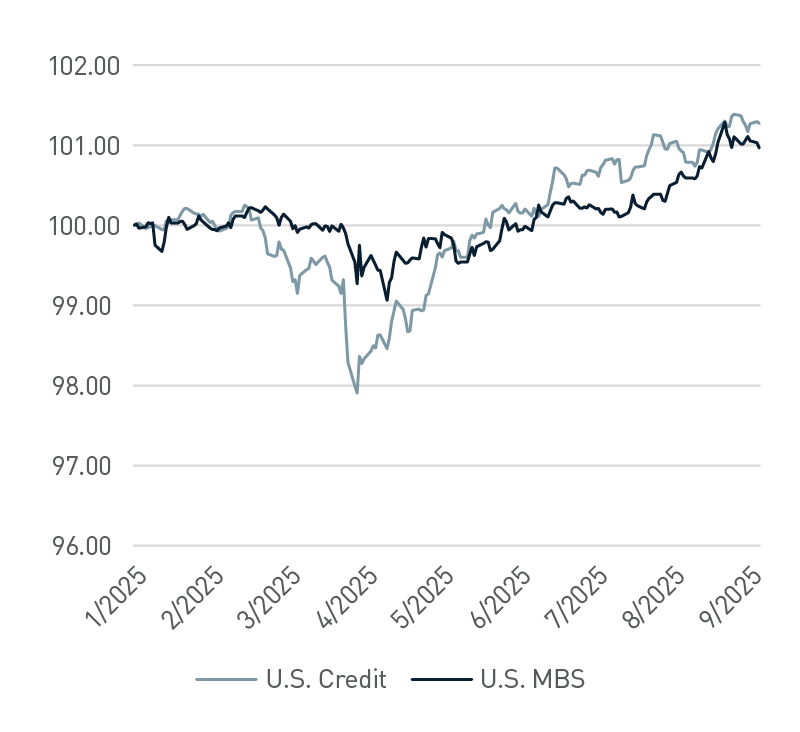
*Data indexed to 100. As of 9/30/2025. Source: Bloomberg L.P. View accessible version of chart.
Figure 1. Third-quarter Sector Excess Returns and Option-adjusted Spreads
| Category |
Excess Returns (%) |
Option-adjusted Spread, Quarterly Change (bps) |
| U.S. Credit |
0.97 |
-9 |
| U.S. Credit Industrial |
0.94 |
-8 |
| U.S. Credit Utility |
1.31 |
-11 |
| U.S. Credit Financial Inst. |
0.94 |
-11 |
| MBS |
0.83 |
-6 |
| ABS |
0.39 |
-8 |
| U.S. Corporate High Yield |
1.29 |
-23 |
Figure 2. Top Monthly New Investment Grade Corporate Bond Issuance Volumes
| Date |
Volume ($B) |
| 9/30/2025 |
207 |
| 3/31/2022 |
230 |
| 5/31/2020 |
243 |
| 3/31/2020 |
259 |
| 4/30/2020 |
286 |
Figure 3. Year-to-date Excess Return
| Date |
U.S. Credit |
U.S. MBS |
| 1/1/2025 |
100.00 |
100.59 |
| 2/2/2025 |
100.03 |
100.11 |
| 3/3/2025 |
99.61 |
100.18 |
| 4/1/2025 |
99.15 |
99.77 |
| 5/1/2025 |
98.68 |
99.57 |
| 6/2/2025 |
99.91 |
100.01 |
| 7/1/2025 |
100.41 |
100.13 |
| 8/1/2025
|
100.54 |
99.97 |
| 9/1/2025 |
100.79 |
100.00 |
Important Disclosures
Index definitions are available at https://www.pnccapitaladvisors.com/index-definitions/
This publication is for informational purposes only. Information contained herein is believed to be accurate, but has not been verified and cannot be guaranteed. Opinions represented are not intended as an offer or solicitation with respect to the purchase or sale of any security and are subject to change without notice. Statements in this material should not be considered investment advice or a forecast or guarantee of future results. To the extent specific securities are referenced herein, they have been selected on an objective basis to illustrate the views expressed in the commentary. Such references do not include all material information about such securities, including risks, and are not intended to be recommendations to take any action with respect to such securities. The securities identified do not represent all of the securities purchased, sold or recommended and it should not be assumed that any listed securities were or will prove to be profitable. Past performance is no guarantee of future results.
PNC Capital Advisors, LLC claims compliance with the Global Investment Performance Standards (GIPS®). A list of composite descriptions for PNC Capital Advisors, LLC and/or a presentation that complies with the GIPS® standards are available upon request.
PNC Capital Advisors, LLC is a wholly-owned subsidiary of PNC Bank N.A. and an indirect subsidiary of The PNC Financial Services Group, Inc. serving institutional clients. PNC Capital Advisors’ strategies and the investment risks and advisory fees associated with each strategy can be found within Part 2A of the firm’s Form ADV, which is available at https://pnccapitaladvisors.com.
©2025 The PNC Financial Services Group, Inc. All rights reserved.
FOR INSTITUTIONAL USE ONLY
INVESTMENTS: NOT FDIC INSURED-NO BANK GUARANTEE – MAY LOSE VALUE