Macro
The July 30 Federal Open Market Committee meeting was largely uneventful as there were no adjustments to the policy rate or material changes to the prior meeting’s statement.
While it was notable that two members of the Federal Reserve Board of Governors dissented, preferring a rate cut at the meeting, this was generally anticipated in advance.
July inflation reports showed upward price pressures on goods, possibly indicating passthrough impacts from tariffs.
Labor reports for July were disappointing, with a cumulative 258,000 negative revision to the prior two months of payroll growth. The unemployment rate rose to 4.2%, while the labor force participation rate fell to 62.2%.
Following the lackluster report, implied market probabilities for a September rate cut increased to nearly 90%.
Credit
During July, approximately $80 billion in new issuance was priced, slightly below expectations. Forecasts for August anticipate $95 billion of new supply.
In July, credit markets experienced strong performance as the Bloomberg U.S. Investment Grade Credit Index tightened seven basis points (bps), to an option-adjusted spread of 72 bps.
This represented a new year-to-date low and was within just one basis point of the post-global financial crisis low of 71 bps that was reached in November 2024.
Structured
July activity in ABS markets was robust with $41.1 billion in new issuance.
Strong technical demand remains entrenched as deals remain well oversubscribed, leading to tighter spreads.
Excess returns for the Bloomberg Mortgage-backed Securities Index were flat for the month as lower quality sectors outperformed.
Chart of the Month
Corporate Bond Spreads, 12/31/21-Present*
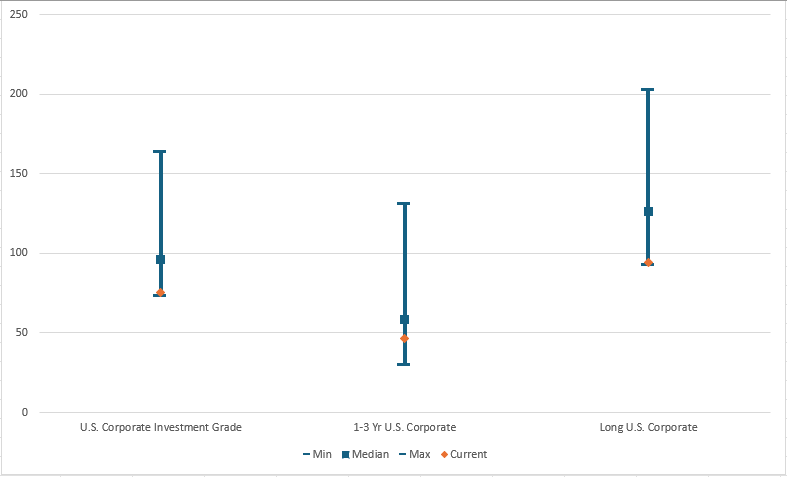
- Investment-grade risk premiums are currently expensive relative to historical ranges.
- Long-duration spreads are particularly rich, while shorter-duration spreads are moderately more attractive on a relative basis.
*Orange diamond denotes current value. As of 7/31/2025. Source: Bloomberg L.P. View accessible version of chart.
Market Data
| Yields |
YTM % |
MTD Change |
QTD Change |
YTD Change |
| 3-Mo UST |
4.34 |
0.04 |
0.04 |
0.02 |
| 2-Yr UST |
3.96 |
0.24 |
0.24 |
-0.29 |
| 5-Yr UST |
3.97 |
0.18 |
0.18 |
-0.41 |
| 10-Yr UST |
4.38 |
0.15 |
0.15 |
-0.20 |
| 30-Yr UST |
4.90 |
0.13 |
0.13 |
0.12 |
| Risk Premia |
OAS (bps) |
MTD Change |
QTD Change |
YTD Change |
| Investment Grade Credit |
72 |
-7 |
-7 |
-5 |
| Asset-Backed Securities |
51 |
-6 |
-6 |
7 |
| High Yield |
278 |
-12 |
-12 |
-9 |
As of 7/31/2025. Source: Bloomberg L.P.
Bloomberg Sector/Index Performance (USD)
| |
Duration (yrs.) |
MTD Excess
Return (%) |
YTD Excess
Return (%) |
MTD Total
Return (%) |
YTD Total
Return (%) |
|
Sector
|
| Investment Grade Credit |
6.58 |
0.54 |
0.82 |
0.05 |
4.28 |
| Mortgage-Backed Securities |
5.96 |
0.00 |
0.10 |
-0.40 |
3.81 |
| Asset-Backed Securities |
2.57 |
0.23 |
0.21 |
0.13 |
3.06 |
| High Yield |
2.78 |
0.59 |
1.66 |
0.45 |
5.04 |
| |
Duration (yrs.) |
MTD Excess
Return (%) |
YTD Excess
Return (%) |
MTD Total
Return (%) |
YTD Total
Return (%) |
|
Index
|
| 1-3-Yr Government Credit |
1.79 |
0.03 |
0.15 |
-0.02 |
2.90 |
| Intermediate Government/Credit |
3.67 |
0.14 |
0.29 |
-0.14 |
3.99 |
| U.S. Aggregate |
5.97 |
0.16 |
0.26 |
-0.26 |
3.75 |
As of 7/31/2025. Source: Bloomberg L.P.
Corporate Bond Spreads, 12/31/21-Present*
| |
U.S. Corporate Investment Grade |
1-3 Yr U.S. Corporate |
Long U.S. Corporate |
| Min |
73.58 |
30.08 |
93.29 |
| Median |
96.16 |
58.39 |
126.31 |
| Max |
164.23 |
131.24 |
202.77 |
| Current |
75.71 |
46.27 |
94.12 |
Important Disclosures
This publication is for informational
purposes only. Information contained herein is believed to be accurate, but has
not been verified and cannot be guaranteed. Opinions represented are not
intended as an offer or solicitation with respect to the purchase or sale of
any security and are subject to change without notice. Statements in this
material should not be considered investment advice or a forecast or guarantee
of future results. To the extent specific securities are referenced herein,
they have been selected on an objective basis to illustrate the views expressed
in the commentary. Such references do not include all material information
about such securities, including risks, and are not intended to be
recommendations to take any action with respect to such securities. The
securities identified do not represent all of the securities purchased, sold or
recommended and it should not be assumed that any listed securities were or
will prove to be profitable. Past performance is no guarantee
of future results.
Indices and/or Benchmarks Definitions
PNC Capital Advisors, LLC is a
wholly-owned subsidiary of PNC Bank, National Association, which is a Member
FDIC, and an indirect subsidiary of The PNC Financial Services Group, Inc.
serving institutional clients. PNC Capital Advisors' strategies and the
investment risks and advisory fees associated with each strategy can be found
within Part 2A of the firm's Form ADV.
PNC Capital Advisors, LLC claims
compliance with the Global Investment Performance Standards (GIPS®). A list of
composite descriptions for PNC Capital Advisors, LLC and/or a presentation that
complies with the GIPS® standards are available upon request.
Investments: Not FDIC Insured. No Bank
Guarantee. May Lose Value.
©2025 The PNC Financial Services Group,
Inc. All rights reserved.