Macro
The March headline consumer price index (CPI) report
(released in April) showed a 0.1% month-over-month decline, the first monthly
decrease in nearly five years. Core CPI was also softer, up just 0.1% as travel
related categories exerted downward pressure on inflation. Similarly, the
personal consumption expenditures (PCE) report showed core PCE was unchanged
month-over-month, the tamest pace in five years. Market reaction was muted to
this disinflationary data as they represent the pre-tariff environment.
The April labor report exceeded expectations as
nonfarm payrolls increased 177,000 and the unemployment rate remained at 4.2%.
However, negative revisions from prior months and softer data from other
surveys suggest that worker demand is weakening as employers may be pausing
spending plans until tariff policies become clearer.
2-year U.S. Treasury yields remained below this year's
January peak of 4.38%, ending April at 3.61%. In our view, this reflects
expectations that trade policies will hurt U.S. economic growth later in the
year and force the Federal Reserve to cut interest rates. The market's
expectation for 2025 rate cuts shifted from approximately 75 basis points (bps)
of cuts at the beginning of April, to approximately 100 bps by the end of the
month.
Credit
After a record first quarter, only $15 billion of
investment grade issuance occurred during the first two weeks of April, amid
tremendous market volatility. However, new supply picked up later in the month,
bringing the final monthly tally to more than $100 billion.
Investment grade credit spreads widened 22 bps in the
first six trading days of the month, reaching 111 bps on April 8 as fiscal
policy concerns swept across global financial markets. After the administration
softened trade rhetoric, and paused some tariffs, credit spreads rallied back
to end the month at 100 bps.
Structured
Asset-backed security (ABS) issuance was subdued in
April given broader market volatility. While ABS spreads widened more than
credit, excess returns were less negative given the shorter duration profile.
Following the tariff announcements, the coupon spread
on mortgage-backed securities widened from 20 bps to 164 bps, before retreating
to 159 bps at the end of April.
Chart of the Month
Contribution to Real GDP
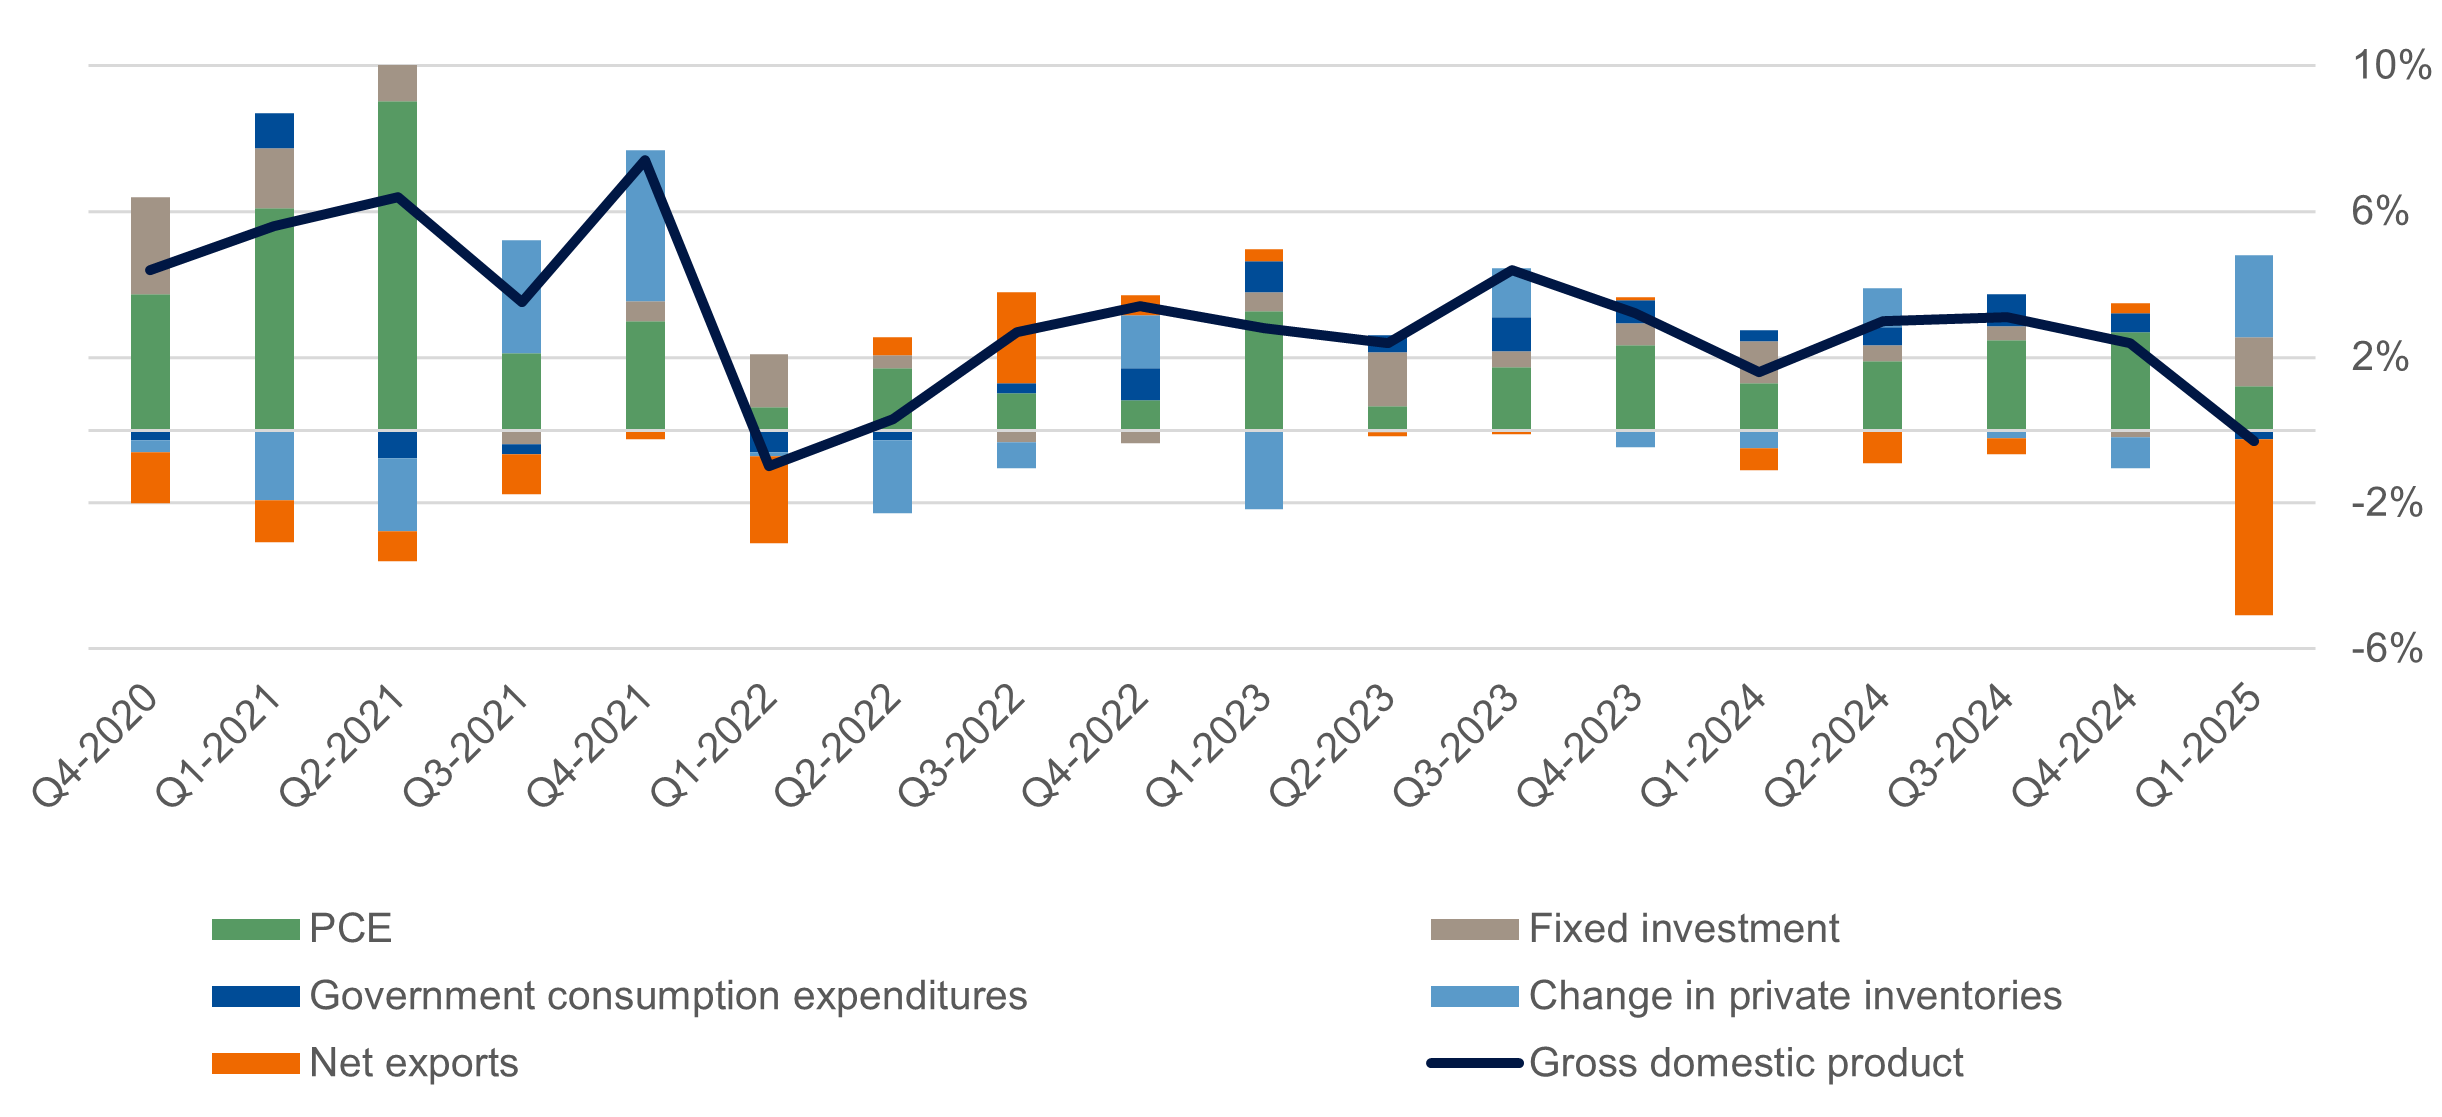
- U.S. GDP
decreased an annualized 0.3% in the first quarter as net exports subtracted
nearly 500 bps, the most on record.
- Net exports
were influenced by a pre-tariff import surge, which we expect to continue to
obscure economic data reports in the coming months.
As of
4/30/2025. Source: Bloomberg L.P. View accessible version of chart.
Market Data
| Yields |
YTM % |
MTD Change |
QTD Change |
YTD Change |
| 3-Mo UST |
4.29 |
-0.01 |
-0.01 |
-0.03 |
| 2-Yr UST |
3.61 |
-0.28 |
-0.28 |
-0.64 |
| 5-Yr UST |
3.73 |
-0.22 |
-0.22 |
-0.66 |
| 10-Yr UST |
4.16 |
-0.04 |
-0.04 |
-0.41 |
| 30-Yr UST |
4.68 |
0.11 |
0.11 |
-0.10 |
| Risk Premia |
OAS (bps) |
MTD Change |
QTD Change |
YTD Change |
| Investment Grade Credit |
100 |
11 |
11 |
23 |
| Asset-Backed Securities |
74 |
14 |
14 |
30 |
| High Yield |
384 |
37 |
37 |
97 |
As of
4/30/2025. Source: Bloomberg L.P.
Bloomberg Sector/Index Performance (USD)
| |
Duration (yrs.) |
MTD Excess
Return (%) |
YTD Excess
Return (%) |
MTD Total
Return (%) |
YTD Total
Return (%) |
|
Sector
|
| Investment Grade Credit |
6.59 |
-0.55 |
-1.33 |
0.06 |
2.43 |
| Mortgage-Backed Securities |
6.00 |
-0.38 |
-0.47 |
0.29 |
3.35 |
| Asset-Backed Securities |
2.54 |
-0.24 |
-0.53 |
0.49 |
2.03 |
| High Yield |
2.97 |
-1.00 |
-2.15 |
-0.02 |
0.98 |
| |
Duration (yrs.) |
MTD Excess
Return (%) |
YTD Excess
Return (%) |
MTD Total
Return (%) |
YTD Total
Return (%) |
|
Index
|
| 1-3-Yr Government Credit |
1.79 |
-0.04 |
-0.01 |
0.76 |
2.39 |
| Intermediate Government/Credit |
3.69 |
-0.15 |
-0.23 |
0.93 |
3.37 |
| U.S. Aggregate |
6.01 |
-0.25 |
-0.49 |
0.39 |
3.18 |
As of 4/30/2025. Source: Bloomberg L.P.
Contribution to Real GDP (%)
| Category |
Q4 2020 |
Q2 2021 |
Q4 2021 |
Q2 2022 |
Q4 2022 |
Q2 2023 |
Q4 2023 |
Q2 2024 |
Q4 2024 |
| Gross domestic product |
4.40 |
6.40 |
7.40 |
0.30 |
3.40 |
2.40 |
3.20 |
3.00 |
2.40 |
| PCE |
3.74 |
9.04 |
3.00 |
1.71 |
0.81 |
0.65 |
2.33 |
1.90 |
2.70 |
| Fixed investment |
2.66 |
0.99 |
0.53 |
0.35 |
-0.36 |
1.48 |
0.62 |
0.42 |
-0.20 |
| Government consumption expenditure |
-0.27 |
-0.78 |
-0.04 |
-0.27 |
0.90 |
0.48 |
0.61 |
0.52 |
0.52 |
| Change in private inventories |
-0.34 |
-2.00 |
4.14 |
-2.01 |
1.44 |
-0.06 |
-0.47 |
1.05 |
-0.84 |
| Net exports |
-1.38 |
-0.82 |
-0.22 |
0.50 |
0.56 |
-0.11 |
0.09 |
-0.90 |
0.26 |
Important Disclosures
This publication is for informational
purposes only. Information contained herein is believed to be accurate, but has
not been verified and cannot be guaranteed. Opinions represented are not
intended as an offer or solicitation with respect to the purchase or sale of
any security and are subject to change without notice. Statements in this
material should not be considered investment advice or a forecast or guarantee
of future results. To the extent specific securities are referenced herein,
they have been selected on an objective basis to illustrate the views expressed
in the commentary. Such references do not include all material information
about such securities, including risks, and are not intended to be
recommendations to take any action with respect to such securities. The
securities identified do not represent all of the securities purchased, sold or
recommended and it should not be assumed that any listed securities were or
will prove to be profitable. Past performance is no guarantee
of future results.
Indices and/or Benchmarks Definitions
PNC Capital Advisors, LLC is a
wholly-owned subsidiary of PNC Bank, National Association, which is a Member
FDIC, and an indirect subsidiary of The PNC Financial Services Group, Inc.
serving institutional clients. PNC Capital Advisors' strategies and the
investment risks and advisory fees associated with each strategy can be found
within Part 2A of the firm's Form ADV.
PNC Capital Advisors, LLC claims
compliance with the Global Investment Performance Standards (GIPS®). A list of
composite descriptions for PNC Capital Advisors, LLC and/or a presentation that
complies with the GIPS® standards are available upon request.
Investments: Not FDIC Insured. No Bank
Guarantee. May Lose Value.
©2025 The PNC Financial Services Group,
Inc. All rights reserved.