Macro
The Federal Reserve (Fed) held
interest rates unchanged at its March meeting, while noting its expectations
for lower growth and higher inflation going forward.
In early April, recent U.S.
tariff policy contributed to stagflation concerns, global market disruption and
a steepening yield curve, which ultimately reflected slowing growth
expectations. As of April 3, the Federal Reserve Bank of Atlanta's GDPNow model
estimate is -2.8% for the first quarter.
Market pricing for Fed rate cuts
has shifted materially in response to the early April tariff announcements;
currently, approximately 100 basis points (bps) of cuts are discounted for the
balance of 2025. Despite the increased volatility and market expectations for
cuts, Fed Chair Jerome Powell noted the Federal Open Market Committee is “well
positioned to wait for greater clarity before considering any adjustments to
our policy stance.”
Credit
Primary markets were active
during March as issuers took advantage of receptive buyer demand prior to the
increased volatility at month-end. Despite the month-end slowdown, investment
grade issuance during the first quarter set a record at $531 billion.
Following the record pace of
issuance in the first quarter, new supply is expected to slow during the month
of April to an estimated $120 billion in investment grade supply.
Investment grade spreads closed
the month of March at 89 bps; however, in early April, spreads continued to
widen, closing the week of April 4 at 103 bps due to tariff volatility and
economic uncertainty. Correspondingly, the ICE BofAML MOVE Index closed at 125,
its highest level since November 2024.
Structured
Asset-backed security spreads
increased during March but recouped some of the widening as issuance slowed and
all-in levels attracted buyers. Auto-backed deals comprised approximately 51%
of new issue volume.
Despite renewed interest rate
volatility, the mortgage-backed sector has outperformed credit year-to-date
given the growing risk-off tone.
Chart of the Month
U.S.
2-Year Breakeven and Real U.S. Treasury Yield* (%)
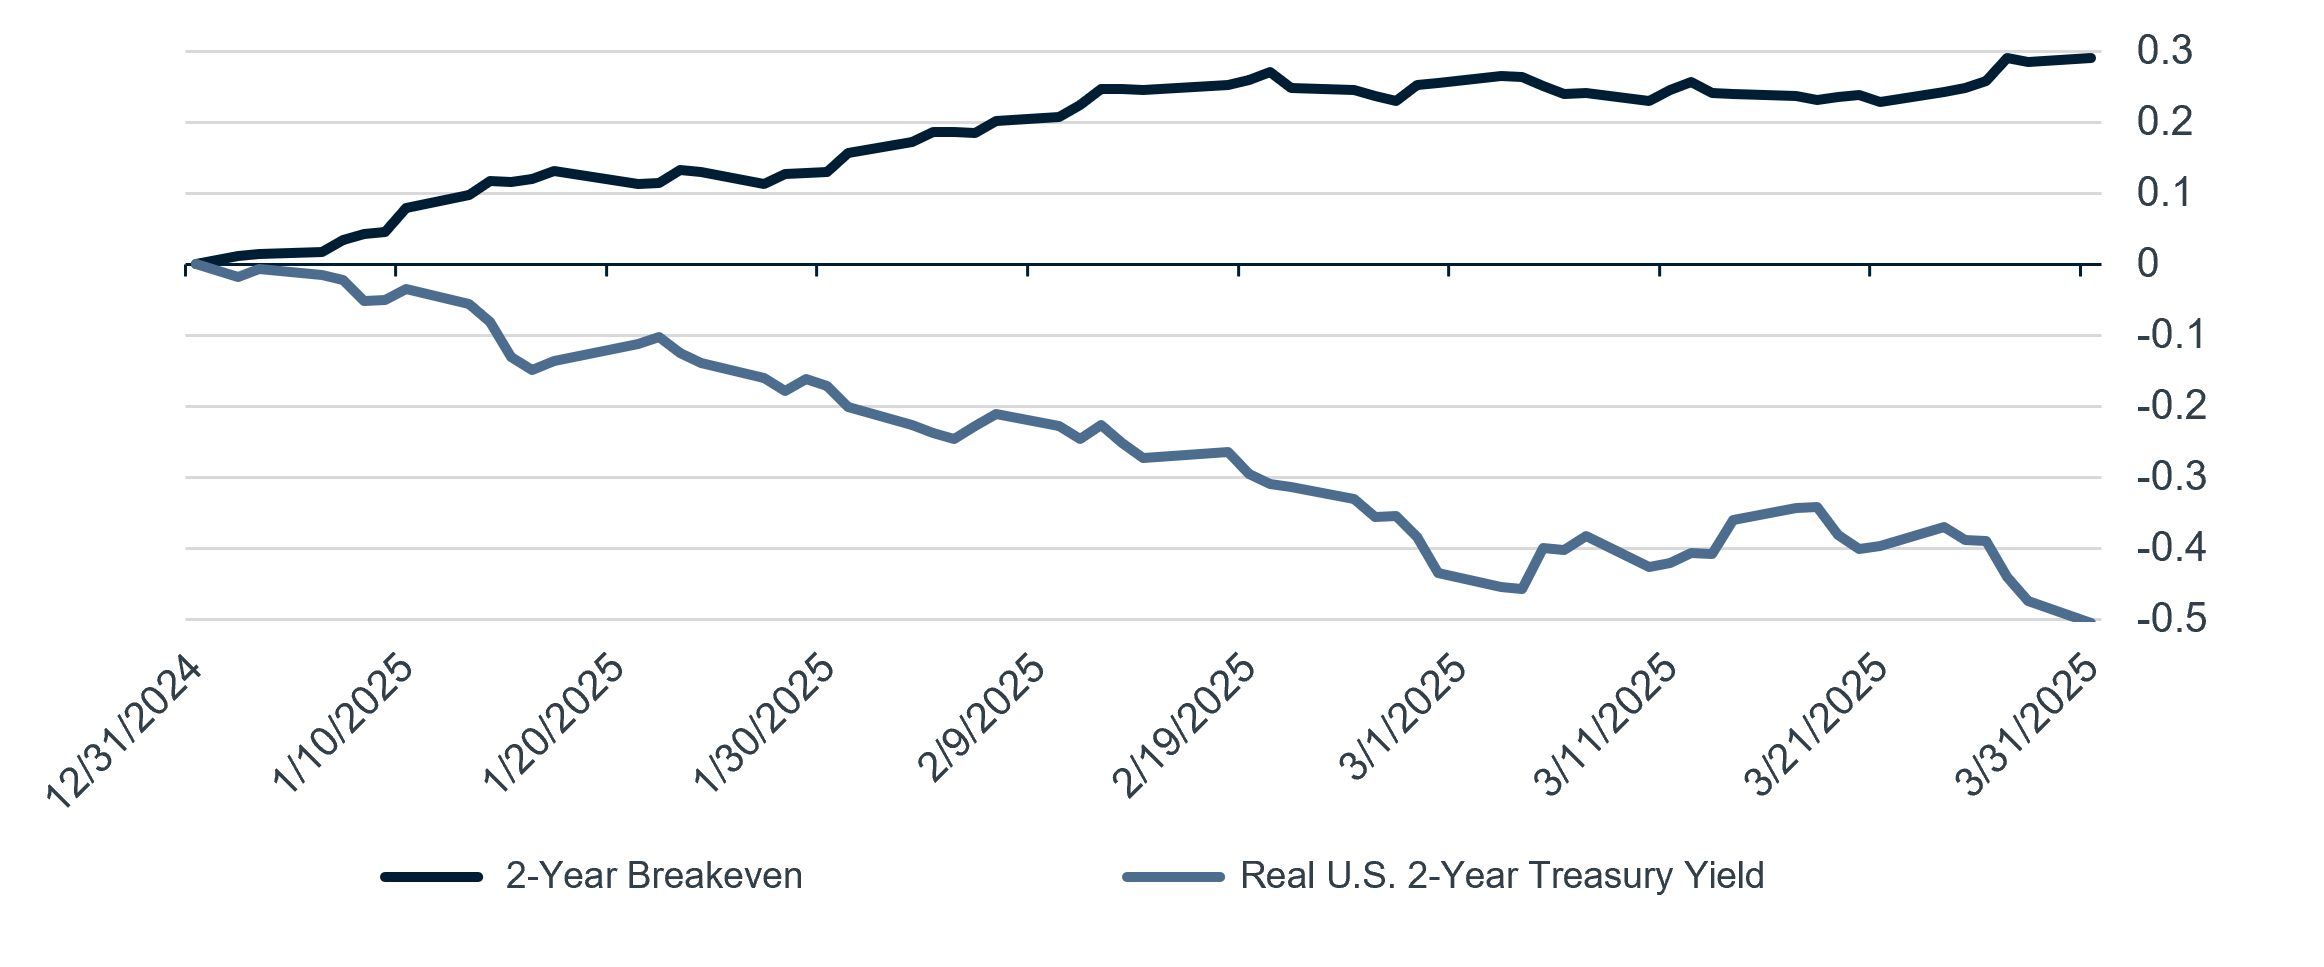
- Year-to-date
real yields have plummeted, while breakeven rates on Treasury
Inflation-Protected Securities have increased.
*Normalized as of 12/31/2024. As of 3/31/2025. Source: Bloomberg L.P.
Market Data
| Yields |
YTM % |
MTD Change |
QTD Change |
YTD Change |
| 3-Mo UST |
4.30 |
0.00 |
-0.02 |
-0.02 |
| 2-Yr UST |
3.89 |
-0.11 |
-0.36 |
-0.36 |
| 5-Yr UST |
3.95 |
-0.07 |
-0.43 |
-0.43 |
| 10-Yr UST |
4.21 |
0.00 |
-0.37 |
-0.37 |
| 30-Yr UST |
4.57 |
0.08 |
-0.21 |
-0.21 |
| Risk Premia |
OAS (bps) |
MTD Change |
QTD Change |
YTD Change |
| Investment Grade Credit |
89 |
6 |
12 |
12 |
| Asset-Backed Securities |
60 |
10 |
16 |
16 |
| High Yield |
347 |
67 |
60 |
60 |
As of 3/31/2025. Source: Bloomberg L.P.
Bloomberg Sector/Index Performance (USD)
| |
Duration (yrs.) |
MTD Excess
Return (%) |
YTD Excess
Return (%) |
MTD Total
Return (%) |
YTD Total
Return (%) |
|
Sector
|
| Investment Grade Credit |
6.62 |
-0339 |
-0.76 |
-0.24 |
2.36 |
| Mortgage-Backed Securities |
5.90 |
-0.27 |
-0.07 |
-0.02 |
3.06 |
| Asset-Backed Securities |
2.56 |
-0.18 |
-0.29 |
0.23 |
1.53 |
| High Yield |
3.01 |
-1.51 |
-1.13 |
-1.02 |
1.00 |
| |
Duration (yrs.) |
MTD Excess
Return (%) |
YTD Excess
Return (%) |
MTD Total
Return (%) |
YTD Total
Return (%) |
|
Index
|
| 1-3-Yr Government Credit |
1.78 |
-0.01 |
0.03 |
0.46 |
1.63 |
| Intermediate Government/Credit |
3.67 |
-0.06 |
-0.08 |
0.44 |
2.42 |
| U.S. Aggregate |
6.01 |
-0.18 |
-0.23 |
0.04 |
2.78 |
As of 3/31/2025. Source: Bloomberg L.P.
Important Disclosures
This publication is for informational
purposes only. Information contained herein is believed to be accurate, but has
not been verified and cannot be guaranteed. Opinions represented are not
intended as an offer or solicitation with respect to the purchase or sale of
any security and are subject to change without notice. Statements in this
material should not be considered investment advice or a forecast or guarantee
of future results. To the extent specific securities are referenced herein,
they have been selected on an objective basis to illustrate the views expressed
in the commentary. Such references do not include all material information
about such securities, including risks, and are not intended to be
recommendations to take any action with respect to such securities. The
securities identified do not represent all of the securities purchased, sold or
recommended and it should not be assumed that any listed securities were or
will prove to be profitable. Past performance is no guarantee
of future results.
Indices and/or Benchmarks Definitions
PNC Capital Advisors, LLC is a
wholly-owned subsidiary of PNC Bank, National Association, which is a Member
FDIC, and an indirect subsidiary of The PNC Financial Services Group, Inc.
serving institutional clients. PNC Capital Advisors' strategies and the
investment risks and advisory fees associated with each strategy can be found
within Part 2A of the firm's Form ADV.
PNC Capital Advisors, LLC claims
compliance with the Global Investment Performance Standards (GIPS®). A list of
composite descriptions for PNC Capital Advisors, LLC and/or a presentation that
complies with the GIPS® standards are available upon request.
Investments: Not FDIC Insured. No Bank
Guarantee. May Lose Value.
©2025 The PNC Financial Services Group,
Inc. All rights reserved.