Fixed income investors are, by necessity, a pessimistic lot; unlike equities that have theoretical unlimited upside, the best we can hope for is to get our principal back at maturity. While this is a gross oversimplification of fixed income investing, it does speak to a fundamental tenet of our strategies: we believe it is essential to understand the symmetry of returns.
Failure to understand the relationship between risk and return and whether it is relatively balanced or skews toward one direction could lead to significant underperformance. In fixed income, it could be said, sometimes the best offense is a good defense.
We address the concept of symmetry through our risk focused approach, which is premised on providing our clients with an investment experience that minimizes undue performance volatility. To help achieve this, we regularly perform historical market analyses to provide context for the symmetry of potential return outcomes. We frame relative value opportunities and risk positioning across a matrix of more than 50 market subsectors using historical excess return and volatility analysis.
Intuitively, when spreads are wide and yields are high, it is more likely a portfolio will generate stronger returns. Conversely, in periods of narrow spreads and low yields, we believe it is prudent to consider a more defensive portfolio position in order to protect capital, as historically, low risk premiums do not offer significant compensation relative to the potential for negative excess returns. This asymmetric risk profile is most acute in longer-duration securities, reflected by a security’s spread duration (that is, the sensitivity of price to a change in spread). This relationship, combined with our ongoing excess return and volatility analyses, inform our portfolio positioning.
Take the current market environment, for example; Figure 1 shows current option-adjusted spreads (OAS) and corresponding percentile rankings for subsets of the ICE BofA U.S. Corporate & Yankee Index over the three-year period ended June 30, 2021, broken down by quality and maturity. Across the board, investment grade credit was at the zero percentile ranking — the most expensive, tightest spreads in the series.
Figure 1. ICE BofA U.S. Corporate & Yankee Index OAS by Quality and Maturity
Investment grade spreads are at their most expensive level over the past three years.
Source: ICE BofA indices, PNC Capital Advisors
Figure 2. ICE BofA U.S. Corporate & Yankee Index Breakeven Spread by Quality and Maturity
Breakeven spreads are at their tightest level over the past three years.
Source: ICE BofA indices, PNC Capital Advisors
We also consider breakeven spreads when evaluating fixed income securities. This measure quantifies the spread widening necessary to offset the carry benefit of holding a security over a one-year horizon. As you might expect, shorter maturity securities have higher breakevens, as lower durations help minimize price volatility. Conversely, longer maturity securities have lower breakevens. As of June 30, it would take only 10 basis points (bps) of spread widening to offset the carry benefit from holding the index at a spread of 82 bps (Figure 2). Like the OAS percentile analysis, breakeven spreads are currently the worst in the series over the last three years.
As a result, while we remain overweight Credit, given the environment illustrated by Figures 1 and 2, we have moderated our risk profile by reducing our exposure to securities with higher spread durations. Since June 30, credit spreads have generally widened and produced negative excess returns. From June 30 to August 16, the Bloomberg Credit Index widened just 9 bps. While modest, this weaker performance offset between 20- 30% of the year-to-date excess return across a variety of sub-indices (Figure 3).
Figure 3. Bloomberg U.S. Corporate Bond Index Excess Return and Characteristics Comparison
Recent modest spread widening has had an outsized impact on excess returns.
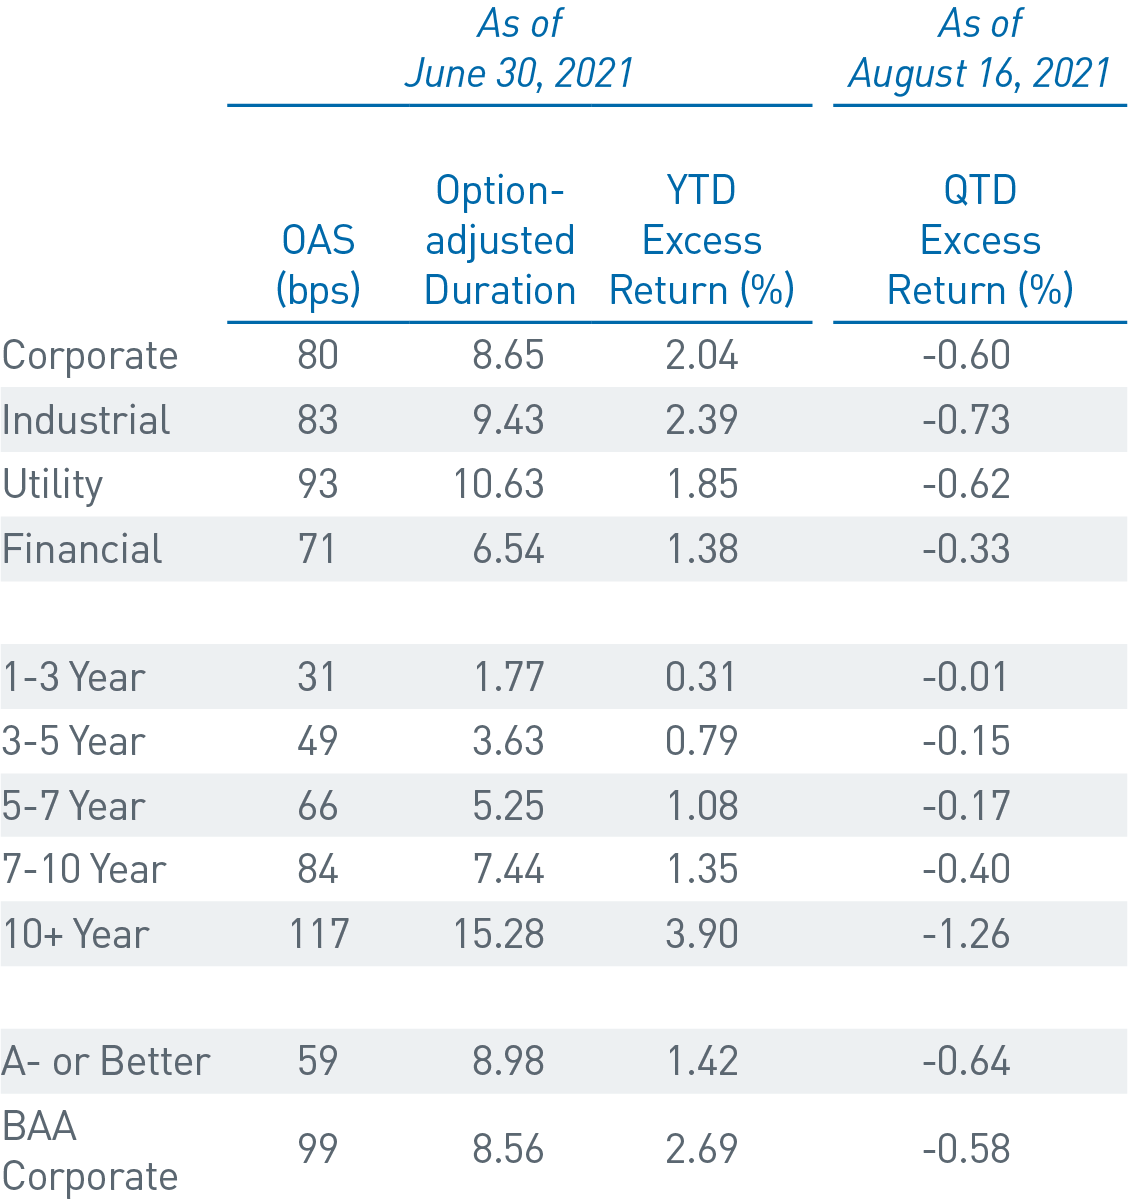
Source: Bloomberg L.P., PNC Capital Advisors
Looking forward, rising caseloads due to the COVID-19 Delta variant have the potential to be a near-term headwind for the ongoing economic recovery. Employment data aside, recent economic releases have generally been weaker than expected and have led to a moderation of growth expectations over the balance of 2021. Additionally, rising geopolitical risks coupled with an expected tapering of the Federal Reserve’s (Fed) asset purchase program have the potential to produce elevated volatility over the coming months and may foster an improved environment for increased spread sector allocations.
Over the last five years, our team has navigated a variety of different market environments: risk-on and risk-off sentiment, rising and falling U.S. Treasury yields, tightening and loosening of policy by the Fed, and increased and decreased volatility. By maintaining our discipline and adhering to our risk-focused approach, we have produced strong excess returns for our clients while limiting volatility. The cornerstone of our investment strategy is risk analysis and management.
Comprehensive risk analysis is incorporated into every step of our investment process. Portfolio construction and management is viewed through a risk-return lens with a focus on consistency. Our investment team continuously evaluates sectors, issuers, and securities using a consistent “FVT” (Fundamentals, Valuation, Tactics) framework to provide a common lens to evaluate relative risk and potential volatility. Furthermore, we perform ongoing quantitative analysis as we seek to ensure the primary dimensions of risk are consistent across our strategies and that client portfolios are in line with their desired objectives.
Figure 4. eVestment Peer Ranking for the Five-Year Period Ended June 30, 2021 – Information Ratio
Core and Core Plus are two among our strategies to rank well against their eVestment peers on information ratio.
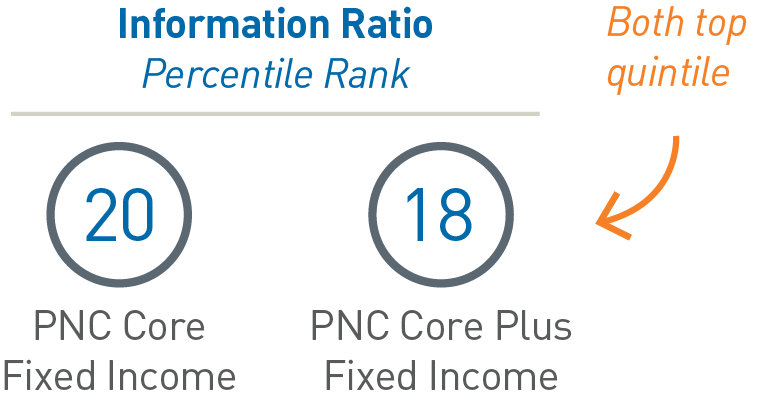
While we apply the same key principles and investment process across all our strategies, to exemplify our process in action, we would point to our eVestment peer universe information ratio (i.e., return per unit of risk relative to a benchmark) ranking our Core Fixed Income and Core Plus Fixed Income strategies, as they represent a broad maturity/duration profile and wide range of fixed income sectors (Figure 4). Both rank in the top quintile over the five-year period ended June 30, 2021. We believe our ability to consistently produce investment results with more downside protection and less volatility than a majority of our peers is a direct result of our disciplined, risk-focused process.
Presentation of Performance of Market Indices
Various market indices may be referred to in these materials. Please see following for a brief description of these indices and comparisons. Indices are unmanaged and not available for direct investment. The performance of an index does not reflect expenses associated with the active management of an actual portfolio.
The ICE BofA U.S. Corporate & Yankee Index tracks the performance of US dollar denominated investment grade debt publicly issued in the U.S. domestic market by U.S. and non-U.S. corporations and non-U.S. quasi-governments.
The Bloomberg U.S. Corporate Bond Index measures the investment-grade, fixed-rate, taxable corporate bond market
Important Disclosures
"Bloomberg®" and the Bloomberg indices are service marks of Bloomberg Finance L.P. and its affiliates, including Bloomberg Index Services Limited (“BISL”), the administrator of the index (collectively, “Bloomberg”) and have been licensed for use for certain purposes by PNC Capital Advisors LLC. (PCA). Bloomberg is not affiliated with PCA, and Bloomberg does not approve, endorse, review, or recommend this material. Bloomberg does not guarantee the timeliness, accurateness, or completeness of any data or information relating to the information herein.
This publication is for informational purposes only. Information contained herein is believed to be accurate, but has not been verified and cannot be guaranteed. Opinions represented are not intended as an offer or solicitation with respect to the purchase or sale of any security and are subject to change without notice. Statements in this material should not be considered investment advice or a forecast or guarantee of future results. To the extent specific securities are referenced herein, they have been selected on an objective basis to illustrate the views expressed in the commentary. Such references do not include all material information about such securities, including risks, and are not intended to be recommendations to take any action with respect to such securities. The securities identified do not represent all of the securities purchased, sold or recommended and it should not be assumed that any listed securities were or will prove to be profitable. Past performance is no guarantee of future results.
PNC Capital Advisors, LLC claims compliance with the Global Investment Performance Standards (GIPS®). A list of composite descriptions for PNC Capital Advisors, LLC and/or a presentation that complies with the GIPS® standards are available upon request.
PNC Capital Advisors, LLC is a wholly-owned subsidiary of PNC Bank N.A. and an indirect subsidiary of The PNC Financial Services Group, Inc. serving institutional clients. PNC Capital Advisors’ strategies and the investment risks and advisory fees associated with each strategy can be found within Part 2A of the firm’s Form ADV, which is available at https://pnccapitaladvisors.com.
©2021 The PNC Financial Services Group, Inc. All rights reserved.
FOR INSTITUTIONAL USE ONLY
INVESTMENTS: NOT FDIC INSURED-NO BANK GUARANTEE – MAY LOSE VALUE