First Quarter Highlights
-
The economic growth outlook for 2021 has significantly improved due to additional fiscal stimulus and an expanded vaccine distribution effort.
-
Recent economic statistics support the “V-shaped” recovery narrative, with particularly strong trends in the manufacturing and housing sectors.
-
The Federal Reserve (Fed) remains steadfast in its commitment to accommodative policy as it plans to continue the current pace of asset purchases until employment and inflation measures progress towards long-term objectives.
-
Following successful passage of the $1.9 trillion stimulus bill, the Biden administration has proposed an infrastructure spending plan along with a proposal to increase corporate tax rates.
-
U.S. Treasury (UST) yields, particularly longer-dated maturities, have reacted to the increased federal spending and improving economic outlook by moving higher, resulting in the steepest yield curve in more than five years.
-
Credit spreads continued to compress in the first quarter, with longer-duration and lower-quality issuers performing best.
-
Volatility was generally confined to the UST market as increased reflationary prospects were priced into expectations, combined with several weak UST note auctions.
Duration Positioning
Neutral
Continue to maintain a benchmark-like duration stance across strategies.
Credit Sector
Overweight
Overweight financials and select industrial sectors, primarily within energy, technology and telecom. Given expensive valuations in short-duration credit, we have extended maturity profiles to optimize exposures where credit curves are steepest.
Structured Products
Neutral in Aggregate strategies, Overweight in short duration strategies
Modestly reduced overweight's in Asset-Backed securities while adding to Agency Mortgage-Backed Security allocations.
Sector Review
Investor optimism drove financial markets during the first quarter once it became clear than an economic recovery was successfully picking up steam. Accelerated vaccine distribution coupled with additional fiscal stimulus has led to lofty economic growth projections for the balance of 2021. Recent economic statistics (particularly from the manufacturing and housing sectors) support confidence in the outlook (Chart 1). Given this backdrop, markets have continued to build on the reflationary theme from the prior quarter, as intermediate- and long-dated UST yields moved substantially higher and the curve steepened. Accordingly, the Bloomberg Barclays Aggregate Index realized a negative total return of 3.37% for the quarter. Excess returns were positive for all primary investment-grade sectors, but at only 35 basis points (bps), it did little to counteract the impact of the UST curve bear steepening (Table 1). While spreads were generally tighter across sectors by the end of March, many sectors struggled to find footing during the quarter as volatility in rates markets developed in the second half of February.
Table 1
Sector Comparison
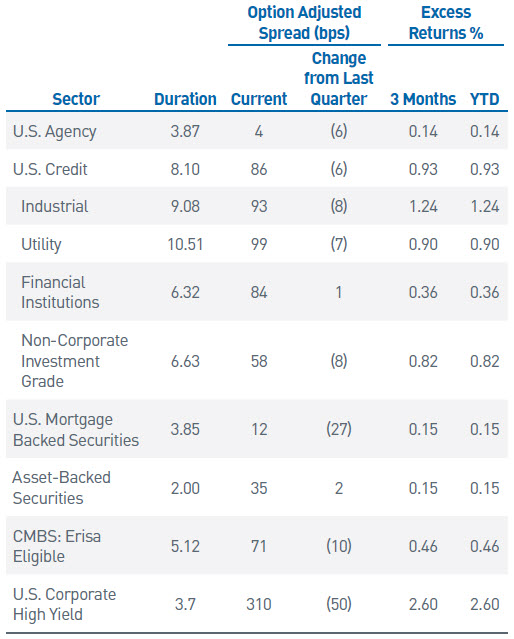
As of 3/31/21. Source: Bloomberg Barclays
Policy Combo Unlocks Market Risk Appetite...Again
Consistent with its messaging throughout the COVID-19 pandemic, the Fed reaffirmed its decidedly accommodative stance at the latest Federal Open Market Committee (FOMC) meeting despite growing expectations for a robust V-shaped recovery. While FOMC members revised their economic projections substantially higher, they left the central tendency of the forecasted policy rate unchanged at 0 – 25 bps through 2023.
The Fed’s commitment to ensuring a sustained, broad-based recovery remains paramount, in our view. Fed members continue to stress that large swaths of the economy and labor force remain under stress and at risk of being left behind. In line with this objective, the Fed has maintained the current pace of its $120 billion monthly purchases of UST and mortgage-backed securities and has indicated that it will continue to do so for the foreseeable future.
Chart 1
The ISM Index is at its highest level in decades
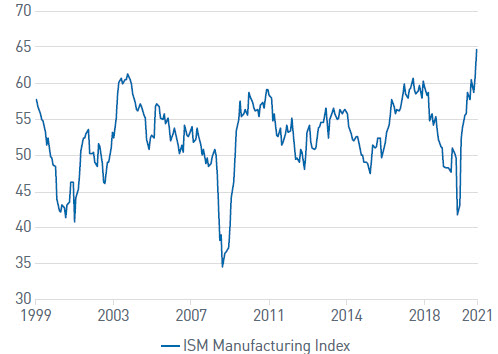
As of 3/31/21. Source: Bloomberg L.P.
Should the recovery proceed as briskly as expected over the balance of 2021, investors will be increasingly mindful of a possible shift towards tapering secondary market activity. This could ultimately presage a subsequent increase in the fed funds target rate. For now, the Fed has largely deferred from offering any clear details on its thought process but has indicated it will provide markets with plenty of advance notice. While changes to its balance sheet strategy may not occur this year, the Fed will need to proceed deliberately and communicate effectively to avoid a “tantrum” like we saw in 2013.
Chart 2
The 2/10 curve is the steepest its been since 2015
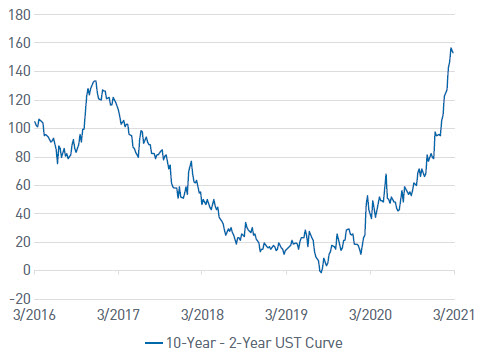
As of 3/31/21. Source: Bloomberg L.P.
Fiscal policy had a substantial impact on financial markets during the quarter as the new administration capitalized on the slim democratic majority in Congress to pass another sizeable round of stimulus. Expectations for GDP growth this year have risen accordingly. Equity and credit markets remain well supported by government spending, and upward pressure on intermediate- and long-term UST rates accelerated. The 2/10 curve steepened to over 150 bps in late March, a level not seen since mid-2015 (Chart 2). The Biden administration is looking to continue implementing bold policy initiatives, introducing a broad infrastructure plan along with proposed changes to corporate tax policy. Right now, a bipartisan deal seems unlikely and there are notable differences within factions of the democratic party. The fiscal policy response is undoubtedly taking pressure off the Fed and allowing it flexibility to see how the recovery develops before initiating additional actions.
A Little Inflation Up in Here, Up in Here
A notable portion of the increase in nominal rates during the quarter was related to changes in inflation expectations. The 10-year breakeven spread rose by 30 bps, while the real yield rose by over 40 bps. Reflecting both strong global economic growth and supply/shipping bottlenecks, broad commodity prices increased by more than 10%, and West Texas Intermediate oil prices surged nearly 22%. Over the next few months, headline increases in many inflation statistics will likely be considerably higher due to base effects, as they will be compared to periods in 2020 that coincided with the peak of COVID-related economic disruptions. Both the Fed and the Biden administration are leaning into a narrative of the transitory nature of these headline data. With a high level of ongoing monetary policy support and the potential for additional fiscal outlays, pent-up demand could foment further concerns about inflation. The Fed has not materially adjusted its longer-run inflation projection of 2% and remains focused on a symmetrical bound around that objective. We will continue to monitor developments in this area closely as rising inflation could lead to both increased market volatility and a potential shift to a tighter policy framework for the Fed.
Opportunity Buds from Volatility
For the most part, volatility during the first quarter was limited to the Treasury market (see our March 2021 commentary, Consternation and Convexity – A Silver Lining Playbook?, resulting in higher yields beyond the 0 – 2-year part of the curve, which remains firmly anchored by Fed policy. However, the rapid repricing in the Treasury market did have some direct effects across investment-grade sectors.
Corporate issuers were eager to secure funding or refinance existing debt before potential further yield increases, which led to considerable new-issue supply, consistent with the record pace seen in 2020. Investor demand was largely able to absorb this issuance, but there were moments where market indigestion was evident (e.g., wider pricing concessions and/or instances of new debt trading sluggishly in the secondary market). Off-the-run securities were impacted by the rapid yield steepening, leading to wider spreads relative to the nearest maturity UST security. This presented us with opportunities to optimize our positioning by adding to those portions of the market where spreads widened and curves steepened, creating the potential for improved total return dynamics for client portfolios as these securities roll down the curve over time.
Chart 3
Rising MBS rates have slowed refinancing's and extended the duration of the MBS sector
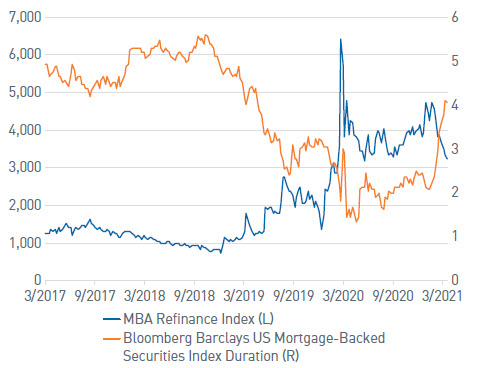
As of 3/31/21. Source: Bloomberg L.P.
Similarly, the MBS market was shaken by the surge in UST yields. Prepayment assumptions slowed due to higher mortgage rates, and related selling amplified the yield move as the duration of the Bloomberg Barclays US Mortgage-Backed Securities Index roughly doubled over the last couple of months. The Fed’s commitment to ongoing purchases helped the market stabilize; however, with elevated new MBS supply, investors remain somewhat skittish of renewed rate volatility. Alternatively, higher rates have led to a slower pace of refinancing activity, which provides a more favorable backdrop moving forward. Given these competing factors, we remain neutral in MBS in our aggregate strategies. In non-aggregate strategies, where our MBS allocations are overweight, we continue to emphasize defensive 10- and 15-year passthrough securities that have a more favorable convexity profile in an environment with heightened extension risk.
We believe similar scenarios are likely to persist when interest rate volatility is elevated, which could be a routine event given the outsized influence policymakers have in markets and the potential for any pivots in their respective strategies. While we firmly believe monetary and fiscal support will remain in place, markets will continue to be sensitive to surprises given the high levels of optimism regarding the near-term outlook, both domestically and globally. Over the last several months, riskier assets have shown tremendous resiliency and have largely shrugged off unexpected developments given the overwhelmingly positive technicals across financial markets. Given the lofty valuations of many asset classes, we feel prudence is warranted during times like these. However, our long-term perspective affords us the flexibility to act quickly to adjust portfolio allocations as opportunities arise.
Important Disclosures
BLOOMBERG® is a trademark and service mark of Bloomberg Finance L.P. and its affiliates (collectively “Bloomberg”). BARCLAYS® is a trademark and service mark of Barclays Bank Plc (collectively with its affiliates, “Barclays”), used under license. Bloomberg or Bloomberg’s licensors, including Barclays, own all proprietary rights in the Bloomberg Barclays Indices. Neither Bloomberg nor Barclays approves or endorses this material, or guarantees the accuracy or completeness of any information herein, or makes any warranty, express or implied, as to the results to be obtained therefrom and, to the maximum extent allowed by law, neither shall have any liability or responsibility for injury or damages arising in connection there with.
This publication is for informational purposes only. Information contained herein is believed to be accurate, but has not been verified and cannot be guaranteed. Opinions represented are not intended as an offer or solicitation with respect to the purchase or sale of any security and are subject to change without notice. Statements in this material should not be considered investment advice or a forecast or guarantee of future results. To the extent specific securities are referenced herein, they have been selected on an objective basis to illustrate the views expressed in the commentary. Such references do not include all material information about such securities, including risks, and are not intended to be recommendations to take any action with respect to such securities. The securities identified do not represent all of the securities purchased, sold or recommended and it should not be assumed that any listed securities were or will prove to be profitable.
Past performance is no guarantee of future results.
PNC Capital Advisors, LLC claims compliance with the Global Investment Performance Standards (GIPS®). A list of composite descriptions for PNC Capital Advisors, LLC and/or a presentation that complies with the GIPS® standards are available upon request.
PNC Capital Advisors, LLC is a wholly-owned subsidiary of PNC Bank N.A. and an indirect subsidiary of The PNC Financial Services Group, Inc. serving institutional clients. PNC Capital Advisors’ strategies and the investment risks and advisory fees associated with each strategy can be found within Part 2A of the firm’s Form ADV, which is available at
https://pnccapitaladvisors.com
©2021 The PNC Financial Services Group, Inc. All rights reserved.
FOR INSTITUTIONAL USE ONLY
INVESTMENTS: NOT FDIC INSURED-NO BANK GUARANTEE – MAY LOSE VALUE