We believe recent bond market volatility and the corresponding steepening of the yield curve could be teeing up a favorable entry point for long-term fixed income investors.
With optimistic trends in COVID-related hospitalizations and vaccinations, investors are increasingly focused on the second half of 2021 and the growing strength of the U.S. economy. While consumer discretionary and related services industries continue to struggle, the manufacturing and housing sectors are driving GDP growth expectations for 2021 well above 5%. Survey and market-based measures of inflation rose in anticipation of Congress passing significant additional fiscal stimulus measures. This improving outlook has led to a steepening of the yield curve and other shifting bond market dynamics (Exhibit 1).
Despite the headline move in these various data points, volatility shook markets during the last week of February as results of the month’s 7-year U.S. Treasury (UST) note auction were released, which suggested tepid investor demand. Equity markets weakened on this news, particularly technology-related shares, and the 10-year UST note yield briefly pushed above 1.6%. UST yields stabilized and trended lower the following day as many investors appeared to view the rates market as oversold. While financial markets could be susceptible to additional shocks from increased interest rate volatility, we believe the Federal Reserve (Fed) is committed to ensuring the economy continues on a sustainable path to recovery.
Exhibit 1.
All data for the period of 12/31/20 – 02/28/21
Source: Bloomberg L.P.
The Federal Open Market Committee (FOMC) remains steadfast in its favorable disposition towards accommodative monetary policy for the foreseeable future. The majority of FOMC participants expect the targeted fed funds rate to persist at the lower bound of the current range of 0.00% – 0.25% through at least 2023. Moreover, the Fed has reiterated its commitment to the ongoing expansion of its balance sheet through monthly purchases of $120 billion in UST and Agency mortgage-backed securities (MBS) until inflation and employment measures make substantial progress towards its long-term targets. In fact, during his Congressional testimony on February 23, Fed Chair Jerome Powell stated, “the economy is a long way from our employment and inflation goals.” If changes in interest rates were to cause materially tighter financial conditions or threaten the economic growth outlook, the Fed could pivot to a more accommodative policy by extending the maturity profile of its ongoing purchases.
The recent move higher in rates has not been isolated to the United States. The market value of the Bloomberg Barclays Global Aggregate Negative Yielding Debt Index has fallen to roughly $13.5 trillion, down from a peak of more than $18 trillion in late 2020. This remains elevated on a historical basis and highlights the comparative attractiveness of the U.S. market for international buyers. In addition, the demand for long-duration yield could increase as projected improvements in pension funding ratios may lead to rebalancing in order to de-risk plan portfolios.
Bond Markets - Drum Roll Please…
As the global interest rate environment remains challenging, we believe it is important to remind investors there are a variety of sources of fixed income returns besides yield. First, a steeper, positively-sloped UST curve increases the opportunity for total return related to “roll.” Meaning, if interest rates stabilize, a fixed income security will benefit from the passage of time as it moves down the curve; the steeper the curve, the greater the potential related return. As illustrated in Table 1, the roll component of a bond’s total return can be significant. In this example, we use a theoretical 1-month annualized return of UST securities to demonstrate the impact of roll.
This concept is amplified in the credit sector where off-the-run securities (e.g., a 4-year or 8-year maturity) trade to a reference on-the-run UST benchmark (in this example, the 5-year and 10-year, respectively). This increases the calculated spread of a security relative to the nearest UST maturity and increases the total return opportunity from spread tightening.
Table 1
Roll Effect – A Theoretical Illustration
UST Securities, as of 2/28/21
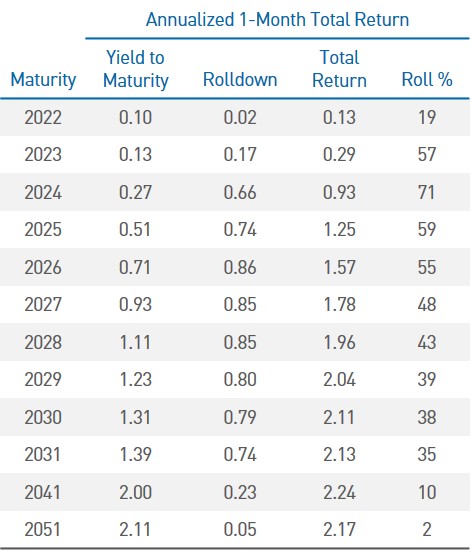
Source: Bloomberg L.P., PNC Capital Advisors
It is also important to consider recent bond market performance from a historical perspective. We analyzed 30 years of Bloomberg Barclays Aggregate Index data to try to put this recent period of market underperformance into context. As shown in Table 2, losses of greater than one percent over a corresponding period occurred 32 times over the last 30 years. In each instance, the index generated a positive return over the following 12 months. At the end of February, the index had a trailing 3-month total return of -2.02%.
Table 2
Historical Analysis of 3-Month Underperformance Periods
Bloomberg Barclays Aggregate Index, as of 2/28/21
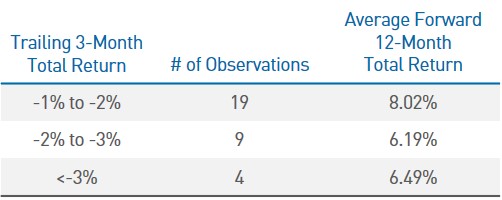
Source: Bloomberg L.P., PNC Capital Advisors
In recent years, fixed income investors have been unaccustomed to negative portfolio returns. However, based on our analysis of historical bond market selloffs, periods like the last few months have historically offered an attractive entry point. As we illustrated, a steeper yield curve can create opportunities for total return from roll by extending portfolio maturity profiles. A steeper yield curve should also generally result in greater compensation per unit of risk for fixed income investors. Taken together, this environment has the potential to broaden the investment universe and therefore improve portfolio diversification and increase comparative relative value. Examples include both high quality Agency MBS as well as investment grade corporate credit. Given the supportive backdrop of a strengthening economy and continued support from both fiscal and monetary authorities, these sectors are an area of focus for appropriate client strategies.
Important Disclosures
BLOOMBERG® is a trademark and service mark of Bloomberg Finance L.P. and its affiliates (collectively “Bloomberg”). BARCLAYS® is a trademark and service mark of Barclays Bank Plc (collectively with its affiliates, “Barclays”), used under license. Bloomberg or Bloomberg’s licensors, including Barclays, own all proprietary rights in the Bloomberg Barclays Indices. Neither Bloomberg nor Barclays approves or endorses this material, or guarantees the accuracy or completeness of any information herein, or makes any warranty, express or implied, as to the results to be obtained therefrom and, to the maximum extent allowed by law, neither shall have any liability or responsibility for injury or damages arising in connection there with.
This publication is for informational purposes only. Information contained herein is believed to be accurate, but has not been verified and cannot be guaranteed. Opinions represented are not intended as an offer or solicitation with respect to the purchase or sale of any security and are subject to change without notice. Statements in this material should not be considered investment advice or a forecast or guarantee of future results. To the extent specific securities are referenced herein, they have been selected on an objective basis to illustrate the views expressed in the commentary. Such references do not include all material information about such securities, including risks, and are not intended to be recommendations to take any action with respect to such securities. The securities identified do not represent all of the securities purchased, sold or recommended and it should not be assumed that any listed securities were or will prove to be profitable. Past performance is no guarantee of future results.
PNC Capital Advisors, LLC claims compliance with the Global Investment Performance Standards (GIPS®). A list of composite descriptions for PNC Capital Advisors, LLC and/or a presentation that complies with the GIPS® standards are available upon request.
PNC Capital Advisors, LLC is a wholly-owned subsidiary of PNC Bank N.A. and an indirect subsidiary of The PNC Financial Services Group, Inc. serving institutional clients. PNC Capital Advisors’ strategies and the investment risks and advisory fees associated with each strategy can be found within Part 2A of the firm’s Form ADV, which is available at https://pnccapitaladvisors.com.
©2021 The PNC Financial Services Group, Inc. All rights reserved.
FOR INSTITUTIONAL USE ONLY
INVESTMENTS: NOT FDIC INSURED-NO BANK GUARANTEE – MAY LOSE VALUE